Pseudomonas phage MR18
Taxonomy: Viruses; Duplodnaviria; Heunggongvirae; Uroviricota; Caudoviricetes; Caudovirales; Autographiviridae; Krylovirinae; unclassified Krylovirinae
Average proteome isoelectric point is 7.03
Get precalculated fractions of proteins
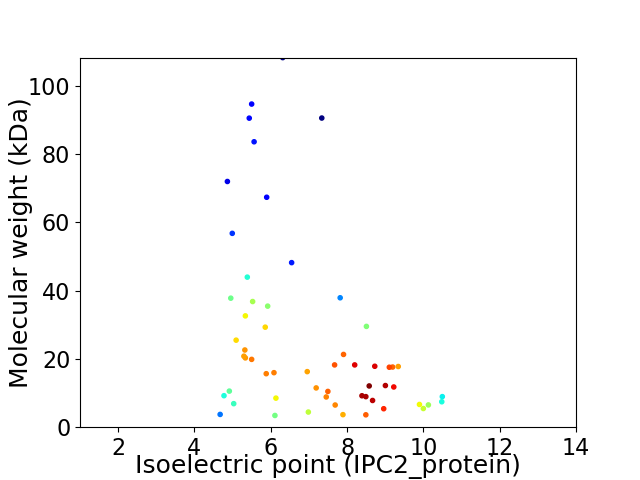
Virtual 2D-PAGE plot for 57 proteins (isoelectric point calculated using IPC2_protein)
Get csv file with sequences according to given criteria:
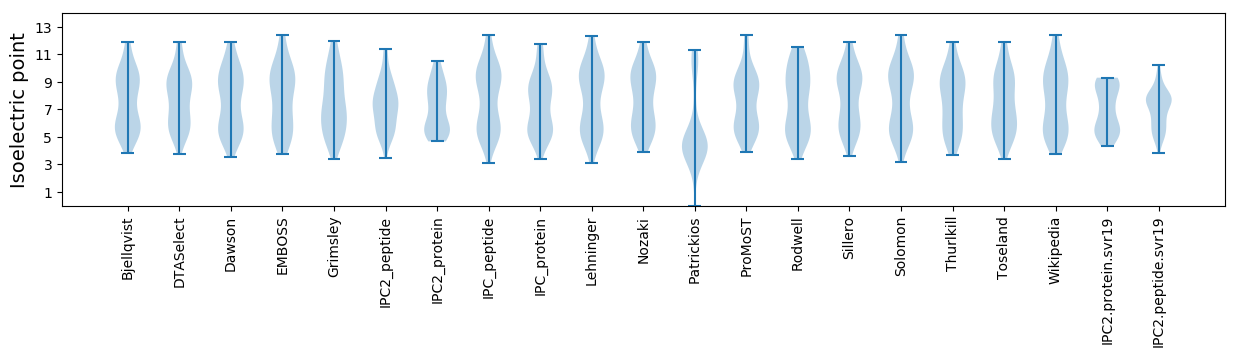
* You can choose from 21 different methods for calculating isoelectric point
Summary statistics related to proteome-wise predictions
Protein with the lowest isoelectric point:
>tr|A0A6M3TE53|A0A6M3TE53_9CAUD Putative DNA endonuclease OS=Pseudomonas phage MR18 OX=2711181 GN=PssvBMR18_gp21 PE=4 SV=1
MM1 pKa = 7.46NSYY4 pKa = 9.54TMTALWIIGCGVAMWALDD22 pKa = 3.7YY23 pKa = 11.4YY24 pKa = 8.42VTSWACIPNN33 pKa = 3.58
MM1 pKa = 7.46NSYY4 pKa = 9.54TMTALWIIGCGVAMWALDD22 pKa = 3.7YY23 pKa = 11.4YY24 pKa = 8.42VTSWACIPNN33 pKa = 3.58
Molecular weight: 3.75 kDa
Isoelectric point according different methods:
Protein with the highest isoelectric point:
>tr|A0A6M3TED2|A0A6M3TED2_9CAUD Uncharacterized protein OS=Pseudomonas phage MR18 OX=2711181 GN=PssvBMR18_gp48 PE=4 SV=1
MM1 pKa = 6.33TTIVYY6 pKa = 10.09HH7 pKa = 6.91RR8 pKa = 11.84GTFAWDD14 pKa = 3.31SRR16 pKa = 11.84ITAGNHH22 pKa = 3.96IVTDD26 pKa = 3.31KK27 pKa = 10.77GMKK30 pKa = 9.59RR31 pKa = 11.84FVEE34 pKa = 4.81GGHH37 pKa = 4.2VFYY40 pKa = 10.86RR41 pKa = 11.84RR42 pKa = 11.84NHH44 pKa = 5.38PRR46 pKa = 11.84GG47 pKa = 3.3
MM1 pKa = 6.33TTIVYY6 pKa = 10.09HH7 pKa = 6.91RR8 pKa = 11.84GTFAWDD14 pKa = 3.31SRR16 pKa = 11.84ITAGNHH22 pKa = 3.96IVTDD26 pKa = 3.31KK27 pKa = 10.77GMKK30 pKa = 9.59RR31 pKa = 11.84FVEE34 pKa = 4.81GGHH37 pKa = 4.2VFYY40 pKa = 10.86RR41 pKa = 11.84RR42 pKa = 11.84NHH44 pKa = 5.38PRR46 pKa = 11.84GG47 pKa = 3.3
Molecular weight: 5.47 kDa
Isoelectric point according different methods:
Peptides (in silico digests for buttom-up proteomics)
Below you can find in silico digests of the whole proteome with Trypsin, Chymotrypsin, Trypsin+LysC, LysN, ArgC proteases suitable for different mass spec machines.| Try ESI |
 |
|---|
| ChTry ESI |
|
|---|
| ArgC ESI |
|
|---|
| LysN ESI |
|
|---|
| TryLysC ESI |
|
|---|
| Try MALDI |
|
|---|
| ChTry MALDI |
|
|---|
| ArgC MALDI |
|
|---|
| LysN MALDI |
|
|---|
| TryLysC MALDI |
|
|---|
| Try LTQ |
|
|---|
| ChTry LTQ |
|
|---|
| ArgC LTQ |
|
|---|
| LysN LTQ |
|
|---|
| TryLysC LTQ |
|
|---|
| Try MSlow |
|
|---|
| ChTry MSlow |
|
|---|
| ArgC MSlow |
|
|---|
| LysN MSlow |
|
|---|
| TryLysC MSlow |
|
|---|
| Try MShigh |
|
|---|
| ChTry MShigh |
|
|---|
| ArgC MShigh |
|
|---|
| LysN MShigh |
|
|---|
| TryLysC MShigh |
|
|---|
General Statistics
Number of major isoforms |
Number of additional isoforms |
Number of all proteins |
Number of amino acids |
Min. Seq. Length |
Max. Seq. Length |
Avg. Seq. Length |
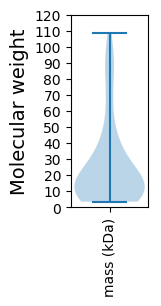
Avg. Mol. Weight |
|---|---|---|---|---|---|---|---|
0 |
13441 |
31 |
1012 |
235.8 |
25.89 |
Amino acid frequency
Ala |
Cys |
Asp |
Glu |
Phe |
Gly |
His |
Ile |
Lys |
Leu |
|---|---|---|---|---|---|---|---|---|---|
10.885 ± 0.425 | 1.257 ± 0.194 |
5.565 ± 0.229 | 5.193 ± 0.298 |
3.013 ± 0.177 | 8.028 ± 0.318 |
2.053 ± 0.205 | 4.077 ± 0.166 |
4.36 ± 0.246 | 8.928 ± 0.232 |
Met |
Asn |
Gln |
Pro |
Arg |
Ser |
Thr |
Val |
Trp |
Tyr |
|---|---|---|---|---|---|---|---|---|---|
2.902 ± 0.153 | 3.98 ± 0.285 |
4.293 ± 0.248 | 4.598 ± 0.326 |
6.294 ± 0.29 | 6.13 ± 0.271 |
6.071 ± 0.289 | 7.566 ± 0.388 |
1.555 ± 0.14 | 3.251 ± 0.203 |
Most of the basic statistics you can see at this page can be downloaded from this CSV file
See this proteome in:

Proteome-pI is available under Creative Commons Attribution-NoDerivs license, for more details see here
| Reference: Kozlowski LP. Proteome-pI 2.0: Proteome Isoelectric Point Database Update. Nucleic Acids Res. 2021, doi: 10.1093/nar/gkab944 | Contact: Lukasz P. Kozlowski |