Human immunodeficiency virus type 1 group M subtype H (isolate 90CF056) (HIV-1)
Taxonomy: Viruses; Riboviria; Pararnavirae; Artverviricota; Revtraviricetes; Ortervirales; Retroviridae; Orthoretrovirinae; Lentivirus; Human immunodeficiency virus 1; HIV-1 group M; HIV-1 M:H
Average proteome isoelectric point is 7.83
Get precalculated fractions of proteins
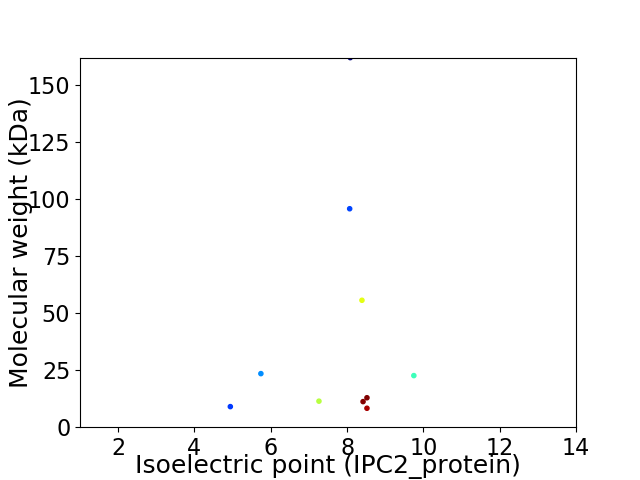
Virtual 2D-PAGE plot for 10 proteins (isoelectric point calculated using IPC2_protein)
Get csv file with sequences according to given criteria:
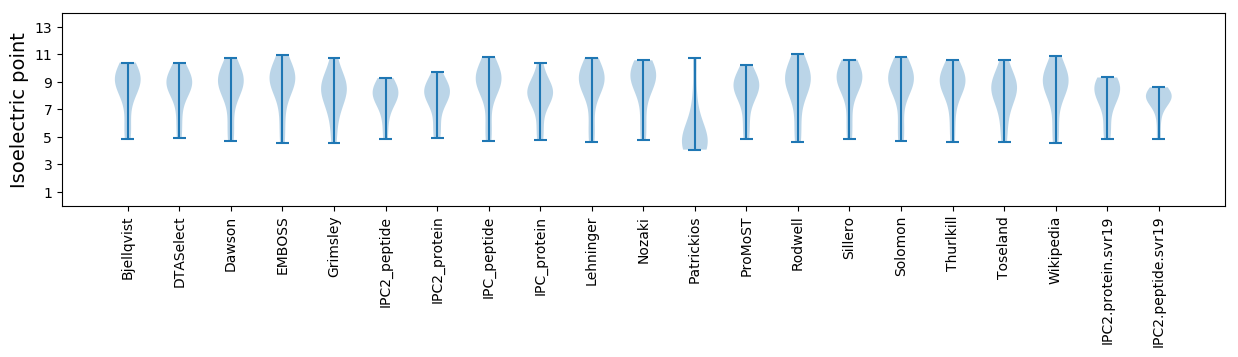
* You can choose from 21 different methods for calculating isoelectric point
Summary statistics related to proteome-wise predictions
Protein with the lowest isoelectric point:
>sp|O70902|ENV_HV190 Envelope glycoprotein gp160 OS=Human immunodeficiency virus type 1 group M subtype H (isolate 90CF056) OX=388826 GN=env PE=3 SV=1
MM1 pKa = 7.52YY2 pKa = 10.38ILGLGIGALVVTFIIAVIVWTIVYY26 pKa = 9.69IEE28 pKa = 4.09YY29 pKa = 10.6KK30 pKa = 10.45KK31 pKa = 10.73LVRR34 pKa = 11.84QKK36 pKa = 10.87KK37 pKa = 8.47IDD39 pKa = 3.65RR40 pKa = 11.84LIEE43 pKa = 4.57RR44 pKa = 11.84IGEE47 pKa = 4.06RR48 pKa = 11.84AEE50 pKa = 4.51DD51 pKa = 3.7SGNEE55 pKa = 3.97SDD57 pKa = 5.62GDD59 pKa = 3.87TEE61 pKa = 4.18EE62 pKa = 4.43LSKK65 pKa = 11.04LMEE68 pKa = 4.5MGHH71 pKa = 6.81LNLGYY76 pKa = 10.6VADD79 pKa = 4.39LL80 pKa = 4.04
MM1 pKa = 7.52YY2 pKa = 10.38ILGLGIGALVVTFIIAVIVWTIVYY26 pKa = 9.69IEE28 pKa = 4.09YY29 pKa = 10.6KK30 pKa = 10.45KK31 pKa = 10.73LVRR34 pKa = 11.84QKK36 pKa = 10.87KK37 pKa = 8.47IDD39 pKa = 3.65RR40 pKa = 11.84LIEE43 pKa = 4.57RR44 pKa = 11.84IGEE47 pKa = 4.06RR48 pKa = 11.84AEE50 pKa = 4.51DD51 pKa = 3.7SGNEE55 pKa = 3.97SDD57 pKa = 5.62GDD59 pKa = 3.87TEE61 pKa = 4.18EE62 pKa = 4.43LSKK65 pKa = 11.04LMEE68 pKa = 4.5MGHH71 pKa = 6.81LNLGYY76 pKa = 10.6VADD79 pKa = 4.39LL80 pKa = 4.04
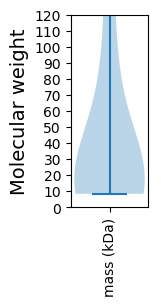
Molecular weight: 9.03 kDa
Isoelectric point according different methods:
Protein with the highest isoelectric point:
>sp|O70898|VPR_HV190 Protein Vpr OS=Human immunodeficiency virus type 1 group M subtype H (isolate 90CF056) OX=388826 GN=vpr PE=3 SV=1
MM1 pKa = 7.3EE2 pKa = 5.21NRR4 pKa = 11.84WQVMIVWQVDD14 pKa = 3.06RR15 pKa = 11.84MRR17 pKa = 11.84INTWKK22 pKa = 10.86SLVKK26 pKa = 9.87YY27 pKa = 10.05HH28 pKa = 5.37MHH30 pKa = 6.89ISRR33 pKa = 11.84KK34 pKa = 8.91ARR36 pKa = 11.84GWFYY40 pKa = 10.74RR41 pKa = 11.84HH42 pKa = 6.17HH43 pKa = 7.06FEE45 pKa = 4.19STHH48 pKa = 5.59PRR50 pKa = 11.84ISSEE54 pKa = 3.7VHH56 pKa = 5.5IPLGEE61 pKa = 4.02ARR63 pKa = 11.84LVITTYY69 pKa = 9.8WGLNTGEE76 pKa = 4.63RR77 pKa = 11.84EE78 pKa = 3.75WHH80 pKa = 6.3LGQGVSIEE88 pKa = 4.02WRR90 pKa = 11.84LKK92 pKa = 9.71RR93 pKa = 11.84YY94 pKa = 7.21STQVEE99 pKa = 4.3PGLADD104 pKa = 3.48QLIHH108 pKa = 5.73MHH110 pKa = 6.2YY111 pKa = 9.75FDD113 pKa = 5.42CFSEE117 pKa = 4.35SAIRR121 pKa = 11.84KK122 pKa = 8.74AILGRR127 pKa = 11.84VVRR130 pKa = 11.84PRR132 pKa = 11.84CNYY135 pKa = 8.68PAGHH139 pKa = 6.15KK140 pKa = 9.88QVGTLQYY147 pKa = 10.88LALTALVAPKK157 pKa = 9.95KK158 pKa = 10.01IKK160 pKa = 10.26PPLPSVRR167 pKa = 11.84KK168 pKa = 9.46LVEE171 pKa = 4.17DD172 pKa = 4.23RR173 pKa = 11.84WNKK176 pKa = 7.26PQKK179 pKa = 9.1TRR181 pKa = 11.84GHH183 pKa = 6.43RR184 pKa = 11.84GSHH187 pKa = 4.85TMNGHH192 pKa = 6.05
MM1 pKa = 7.3EE2 pKa = 5.21NRR4 pKa = 11.84WQVMIVWQVDD14 pKa = 3.06RR15 pKa = 11.84MRR17 pKa = 11.84INTWKK22 pKa = 10.86SLVKK26 pKa = 9.87YY27 pKa = 10.05HH28 pKa = 5.37MHH30 pKa = 6.89ISRR33 pKa = 11.84KK34 pKa = 8.91ARR36 pKa = 11.84GWFYY40 pKa = 10.74RR41 pKa = 11.84HH42 pKa = 6.17HH43 pKa = 7.06FEE45 pKa = 4.19STHH48 pKa = 5.59PRR50 pKa = 11.84ISSEE54 pKa = 3.7VHH56 pKa = 5.5IPLGEE61 pKa = 4.02ARR63 pKa = 11.84LVITTYY69 pKa = 9.8WGLNTGEE76 pKa = 4.63RR77 pKa = 11.84EE78 pKa = 3.75WHH80 pKa = 6.3LGQGVSIEE88 pKa = 4.02WRR90 pKa = 11.84LKK92 pKa = 9.71RR93 pKa = 11.84YY94 pKa = 7.21STQVEE99 pKa = 4.3PGLADD104 pKa = 3.48QLIHH108 pKa = 5.73MHH110 pKa = 6.2YY111 pKa = 9.75FDD113 pKa = 5.42CFSEE117 pKa = 4.35SAIRR121 pKa = 11.84KK122 pKa = 8.74AILGRR127 pKa = 11.84VVRR130 pKa = 11.84PRR132 pKa = 11.84CNYY135 pKa = 8.68PAGHH139 pKa = 6.15KK140 pKa = 9.88QVGTLQYY147 pKa = 10.88LALTALVAPKK157 pKa = 9.95KK158 pKa = 10.01IKK160 pKa = 10.26PPLPSVRR167 pKa = 11.84KK168 pKa = 9.46LVEE171 pKa = 4.17DD172 pKa = 4.23RR173 pKa = 11.84WNKK176 pKa = 7.26PQKK179 pKa = 9.1TRR181 pKa = 11.84GHH183 pKa = 6.43RR184 pKa = 11.84GSHH187 pKa = 4.85TMNGHH192 pKa = 6.05
Molecular weight: 22.63 kDa
Isoelectric point according different methods:
Peptides (in silico digests for buttom-up proteomics)
Below you can find in silico digests of the whole proteome with Trypsin, Chymotrypsin, Trypsin+LysC, LysN, ArgC proteases suitable for different mass spec machines.| Try ESI |
 |
|---|
| ChTry ESI |
|
|---|
| ArgC ESI |
|
|---|
| LysN ESI |
|
|---|
| TryLysC ESI |
|
|---|
| Try MALDI |
|
|---|
| ChTry MALDI |
|
|---|
| ArgC MALDI |
|
|---|
| LysN MALDI |
|
|---|
| TryLysC MALDI |
|
|---|
| Try LTQ |
|
|---|
| ChTry LTQ |
|
|---|
| ArgC LTQ |
|
|---|
| LysN LTQ |
|
|---|
| TryLysC LTQ |
|
|---|
| Try MSlow |
|
|---|
| ChTry MSlow |
|
|---|
| ArgC MSlow |
|
|---|
| LysN MSlow |
|
|---|
| TryLysC MSlow |
|
|---|
| Try MShigh |
|
|---|
| ChTry MShigh |
|
|---|
| ArgC MShigh |
|
|---|
| LysN MShigh |
|
|---|
| TryLysC MShigh |
|
|---|
General Statistics
Number of major isoforms |
Number of additional isoforms |
Number of all proteins |
Number of amino acids |
Min. Seq. Length |
Max. Seq. Length |
Avg. Seq. Length |
Avg. Mol. Weight |
|---|---|---|---|---|---|---|---|
3641 |
72 |
1435 |
364.1 |
41.27 |
Amino acid frequency
Ala |
Cys |
Asp |
Glu |
Phe |
Gly |
His |
Ile |
Lys |
Leu |
|---|---|---|---|---|---|---|---|---|---|
6.262 ± 0.674 | 2.06 ± 0.402 |
4.065 ± 0.327 | 6.756 ± 0.628 |
2.582 ± 0.178 | 7.196 ± 0.319 |
2.307 ± 0.519 | 6.647 ± 0.666 |
7.031 ± 1.122 | 8.239 ± 0.526 |
Met |
Asn |
Gln |
Pro |
Arg |
Ser |
Thr |
Val |
Trp |
Tyr |
|---|---|---|---|---|---|---|---|---|---|
2.389 ± 0.249 | 4.669 ± 0.743 |
5.301 ± 0.576 | 5.987 ± 0.418 |
6.125 ± 0.828 | 5.301 ± 0.48 |
5.932 ± 0.534 | 6.042 ± 0.455 |
2.582 ± 0.264 | 2.527 ± 0.251 |
Most of the basic statistics you can see at this page can be downloaded from this CSV file
See this proteome in:

Proteome-pI is available under Creative Commons Attribution-NoDerivs license, for more details see here
| Reference: Kozlowski LP. Proteome-pI 2.0: Proteome Isoelectric Point Database Update. Nucleic Acids Res. 2021, doi: 10.1093/nar/gkab944 | Contact: Lukasz P. Kozlowski |