Simian immunodeficiency virus - agm.tan-1
Taxonomy: Viruses; Riboviria; Pararnavirae; Artverviricota; Revtraviricetes; Ortervirales; Retroviridae; Orthoretrovirinae; Lentivirus; Simian immunodeficiency virus; Simian immunodeficiency virus - agm; Simian immunodeficiency virus - agm.tan
Average proteome isoelectric point is 7.53
Get precalculated fractions of proteins
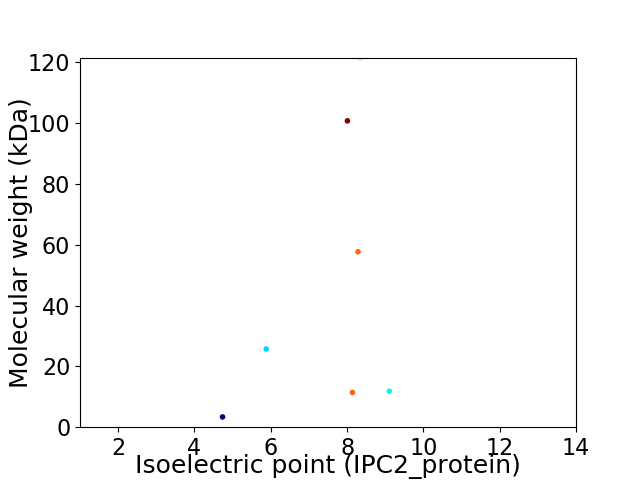
Virtual 2D-PAGE plot for 7 proteins (isoelectric point calculated using IPC2_protein)
Get csv file with sequences according to given criteria:
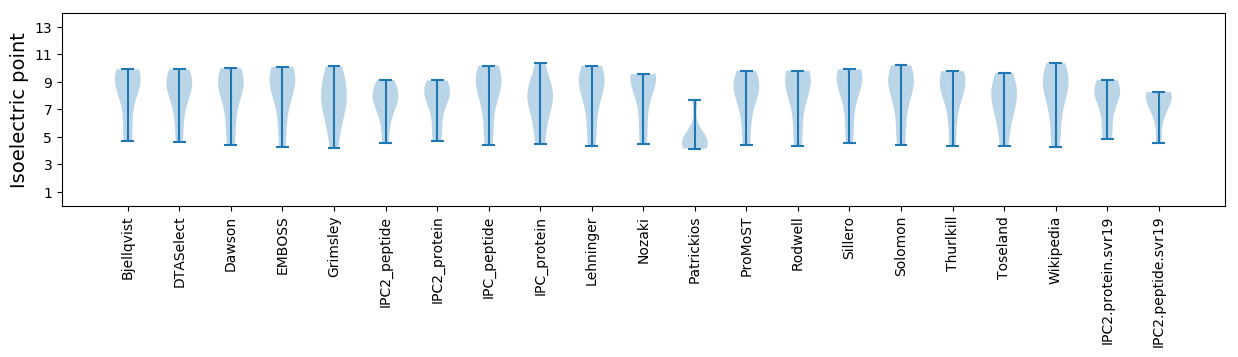
* You can choose from 21 different methods for calculating isoelectric point
Summary statistics related to proteome-wise predictions
Protein with the lowest isoelectric point:
>tr|P89907|P89907_SIVTA Protein Tat OS=Simian immunodeficiency virus - agm.tan-1 OX=349975 GN=tat PE=3 SV=1
MM1 pKa = 7.99AEE3 pKa = 4.05GRR5 pKa = 11.84DD6 pKa = 3.6SRR8 pKa = 11.84EE9 pKa = 3.75RR10 pKa = 11.84RR11 pKa = 11.84PGWLEE16 pKa = 3.13IWDD19 pKa = 4.36LSRR22 pKa = 11.84EE23 pKa = 4.18PWDD26 pKa = 3.46EE27 pKa = 3.77
MM1 pKa = 7.99AEE3 pKa = 4.05GRR5 pKa = 11.84DD6 pKa = 3.6SRR8 pKa = 11.84EE9 pKa = 3.75RR10 pKa = 11.84RR11 pKa = 11.84PGWLEE16 pKa = 3.13IWDD19 pKa = 4.36LSRR22 pKa = 11.84EE23 pKa = 4.18PWDD26 pKa = 3.46EE27 pKa = 3.77
Molecular weight: 3.37 kDa
Isoelectric point according different methods:
Protein with the highest isoelectric point:
>tr|P89909|P89909_SIVTA Envelope glycoprotein gp160 OS=Simian immunodeficiency virus - agm.tan-1 OX=349975 GN=env PE=4 SV=2
MM1 pKa = 7.42SLGSEE6 pKa = 4.06DD7 pKa = 3.92LRR9 pKa = 11.84RR10 pKa = 11.84IIQIIRR16 pKa = 11.84ILYY19 pKa = 9.81HH20 pKa = 6.23SNQYY24 pKa = 10.23PPGEE28 pKa = 3.96GTARR32 pKa = 11.84QRR34 pKa = 11.84RR35 pKa = 11.84RR36 pKa = 11.84RR37 pKa = 11.84RR38 pKa = 11.84QRR40 pKa = 11.84FQQQQRR46 pKa = 11.84QVAALSEE53 pKa = 4.57RR54 pKa = 11.84IFIAQQRR61 pKa = 11.84RR62 pKa = 11.84DD63 pKa = 3.63PSGGEE68 pKa = 3.84SLAAAFDD75 pKa = 3.73QLVLDD80 pKa = 4.07NQQLVIEE87 pKa = 4.64TLPDD91 pKa = 4.06PPQEE95 pKa = 4.13PHH97 pKa = 7.16DD98 pKa = 4.58SSSTAA103 pKa = 3.19
MM1 pKa = 7.42SLGSEE6 pKa = 4.06DD7 pKa = 3.92LRR9 pKa = 11.84RR10 pKa = 11.84IIQIIRR16 pKa = 11.84ILYY19 pKa = 9.81HH20 pKa = 6.23SNQYY24 pKa = 10.23PPGEE28 pKa = 3.96GTARR32 pKa = 11.84QRR34 pKa = 11.84RR35 pKa = 11.84RR36 pKa = 11.84RR37 pKa = 11.84RR38 pKa = 11.84QRR40 pKa = 11.84FQQQQRR46 pKa = 11.84QVAALSEE53 pKa = 4.57RR54 pKa = 11.84IFIAQQRR61 pKa = 11.84RR62 pKa = 11.84DD63 pKa = 3.63PSGGEE68 pKa = 3.84SLAAAFDD75 pKa = 3.73QLVLDD80 pKa = 4.07NQQLVIEE87 pKa = 4.64TLPDD91 pKa = 4.06PPQEE95 pKa = 4.13PHH97 pKa = 7.16DD98 pKa = 4.58SSSTAA103 pKa = 3.19
Molecular weight: 11.84 kDa
Isoelectric point according different methods:
Peptides (in silico digests for buttom-up proteomics)
Below you can find in silico digests of the whole proteome with Trypsin, Chymotrypsin, Trypsin+LysC, LysN, ArgC proteases suitable for different mass spec machines.| Try ESI |
 |
|---|
| ChTry ESI |
|
|---|
| ArgC ESI |
|
|---|
| LysN ESI |
|
|---|
| TryLysC ESI |
|
|---|
| Try MALDI |
|
|---|
| ChTry MALDI |
|
|---|
| ArgC MALDI |
|
|---|
| LysN MALDI |
|
|---|
| TryLysC MALDI |
|
|---|
| Try LTQ |
|
|---|
| ChTry LTQ |
|
|---|
| ArgC LTQ |
|
|---|
| LysN LTQ |
|
|---|
| TryLysC LTQ |
|
|---|
| Try MSlow |
|
|---|
| ChTry MSlow |
|
|---|
| ArgC MSlow |
|
|---|
| LysN MSlow |
|
|---|
| TryLysC MSlow |
|
|---|
| Try MShigh |
|
|---|
| ChTry MShigh |
|
|---|
| ArgC MShigh |
|
|---|
| LysN MShigh |
|
|---|
| TryLysC MShigh |
|
|---|
General Statistics
Number of major isoforms |
Number of additional isoforms |
Number of all proteins |
Number of amino acids |
Min. Seq. Length |
Max. Seq. Length |
Avg. Seq. Length |
Avg. Mol. Weight |
|---|---|---|---|---|---|---|---|
0 |
2922 |
27 |
1067 |
417.4 |
47.47 |
Amino acid frequency
Ala |
Cys |
Asp |
Glu |
Phe |
Gly |
His |
Ile |
Lys |
Leu |
|---|---|---|---|---|---|---|---|---|---|
6.126 ± 0.368 | 2.43 ± 0.515 |
3.97 ± 0.41 | 6.776 ± 0.472 |
2.875 ± 0.153 | 7.495 ± 0.792 |
1.951 ± 0.248 | 5.852 ± 0.854 |
6.947 ± 0.78 | 8.385 ± 0.312 |
Met |
Asn |
Gln |
Pro |
Arg |
Ser |
Thr |
Val |
Trp |
Tyr |
|---|---|---|---|---|---|---|---|---|---|
2.053 ± 0.163 | 4.62 ± 0.661 |
5.373 ± 0.647 | 6.468 ± 0.596 |
5.955 ± 0.647 | 5.236 ± 0.728 |
5.989 ± 0.884 | 5.578 ± 0.346 |
3.114 ± 0.495 | 2.806 ± 0.333 |
Most of the basic statistics you can see at this page can be downloaded from this CSV file
See this proteome in:

Proteome-pI is available under Creative Commons Attribution-NoDerivs license, for more details see here
| Reference: Kozlowski LP. Proteome-pI 2.0: Proteome Isoelectric Point Database Update. Nucleic Acids Res. 2021, doi: 10.1093/nar/gkab944 | Contact: Lukasz P. Kozlowski |