Enterobacter phage Arya
Taxonomy: Viruses; Duplodnaviria; Heunggongvirae; Uroviricota; Caudoviricetes; Caudovirales; Myoviridae; Jilinvirus; unclassified Jilinvirus
Average proteome isoelectric point is 6.36
Get precalculated fractions of proteins
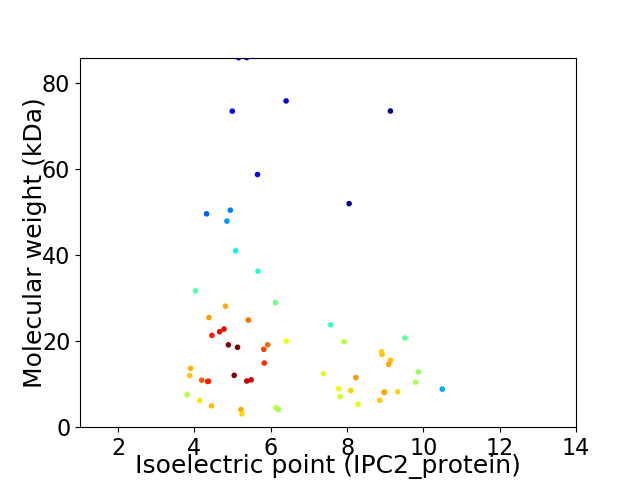
Virtual 2D-PAGE plot for 61 proteins (isoelectric point calculated using IPC2_protein)
Get csv file with sequences according to given criteria:
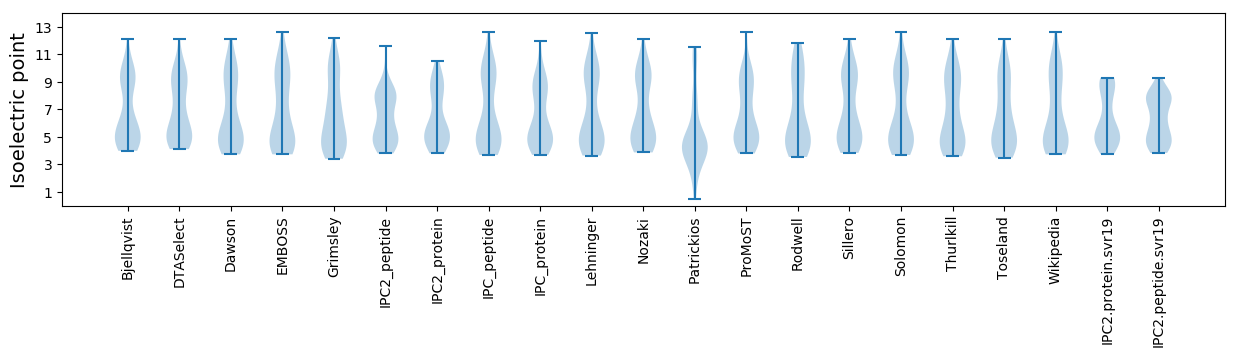
* You can choose from 21 different methods for calculating isoelectric point
Summary statistics related to proteome-wise predictions
Protein with the lowest isoelectric point:
>tr|A0A193GYD1|A0A193GYD1_9CAUD Putative tail protein OS=Enterobacter phage Arya OX=1864622 GN=BI096_gp14 PE=4 SV=1
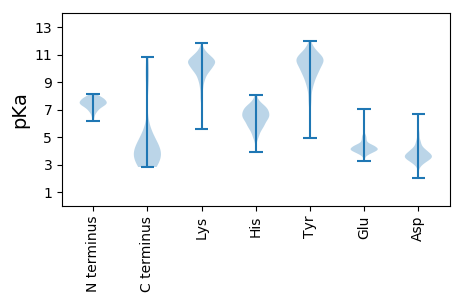
MM1 pKa = 7.72AAQTYY6 pKa = 6.7VTSDD10 pKa = 3.37GDD12 pKa = 3.81TADD15 pKa = 3.97YY16 pKa = 10.59IAWKK20 pKa = 10.49YY21 pKa = 10.78YY22 pKa = 10.19GNQDD26 pKa = 3.55PGTVEE31 pKa = 4.29ALVDD35 pKa = 4.08ANKK38 pKa = 10.57GLADD42 pKa = 4.43IGPLLPAGMVITLPEE57 pKa = 4.02ISTPATQQGIKK68 pKa = 10.22LWDD71 pKa = 3.31
MM1 pKa = 7.72AAQTYY6 pKa = 6.7VTSDD10 pKa = 3.37GDD12 pKa = 3.81TADD15 pKa = 3.97YY16 pKa = 10.59IAWKK20 pKa = 10.49YY21 pKa = 10.78YY22 pKa = 10.19GNQDD26 pKa = 3.55PGTVEE31 pKa = 4.29ALVDD35 pKa = 4.08ANKK38 pKa = 10.57GLADD42 pKa = 4.43IGPLLPAGMVITLPEE57 pKa = 4.02ISTPATQQGIKK68 pKa = 10.22LWDD71 pKa = 3.31
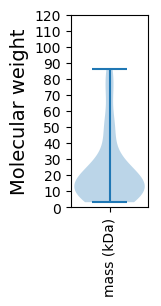
Molecular weight: 7.54 kDa
Isoelectric point according different methods:
Protein with the highest isoelectric point:
>tr|A0A193GYR8|A0A193GYR8_9CAUD Uncharacterized protein OS=Enterobacter phage Arya OX=1864622 GN=BI096_gp44 PE=4 SV=1
MM1 pKa = 6.53TTFAINFIAVCFIFIWASWCVMYY24 pKa = 10.88SGVKK28 pKa = 10.28DD29 pKa = 4.12GIVGKK34 pKa = 10.49LFFSLVAISALAIIIHH50 pKa = 6.26TLTGHH55 pKa = 4.97YY56 pKa = 10.13AKK58 pKa = 10.59RR59 pKa = 11.84PFITMNVSIALVGARR74 pKa = 11.84HH75 pKa = 6.12VFLSWLKK82 pKa = 10.34RR83 pKa = 11.84FKK85 pKa = 10.54AAQQRR90 pKa = 11.84HH91 pKa = 5.13HH92 pKa = 6.44SS93 pKa = 3.77
MM1 pKa = 6.53TTFAINFIAVCFIFIWASWCVMYY24 pKa = 10.88SGVKK28 pKa = 10.28DD29 pKa = 4.12GIVGKK34 pKa = 10.49LFFSLVAISALAIIIHH50 pKa = 6.26TLTGHH55 pKa = 4.97YY56 pKa = 10.13AKK58 pKa = 10.59RR59 pKa = 11.84PFITMNVSIALVGARR74 pKa = 11.84HH75 pKa = 6.12VFLSWLKK82 pKa = 10.34RR83 pKa = 11.84FKK85 pKa = 10.54AAQQRR90 pKa = 11.84HH91 pKa = 5.13HH92 pKa = 6.44SS93 pKa = 3.77
Molecular weight: 10.49 kDa
Isoelectric point according different methods:
Peptides (in silico digests for buttom-up proteomics)
Below you can find in silico digests of the whole proteome with Trypsin, Chymotrypsin, Trypsin+LysC, LysN, ArgC proteases suitable for different mass spec machines.| Try ESI |
 |
|---|
| ChTry ESI |
|
|---|
| ArgC ESI |
|
|---|
| LysN ESI |
|
|---|
| TryLysC ESI |
|
|---|
| Try MALDI |
|
|---|
| ChTry MALDI |
|
|---|
| ArgC MALDI |
|
|---|
| LysN MALDI |
|
|---|
| TryLysC MALDI |
|
|---|
| Try LTQ |
|
|---|
| ChTry LTQ |
|
|---|
| ArgC LTQ |
|
|---|
| LysN LTQ |
|
|---|
| TryLysC LTQ |
|
|---|
| Try MSlow |
|
|---|
| ChTry MSlow |
|
|---|
| ArgC MSlow |
|
|---|
| LysN MSlow |
|
|---|
| TryLysC MSlow |
|
|---|
| Try MShigh |
|
|---|
| ChTry MShigh |
|
|---|
| ArgC MShigh |
|
|---|
| LysN MShigh |
|
|---|
| TryLysC MShigh |
|
|---|
General Statistics
Number of major isoforms |
Number of additional isoforms |
Number of all proteins |
Number of amino acids |
Min. Seq. Length |
Max. Seq. Length |
Avg. Seq. Length |
Avg. Mol. Weight |
|---|---|---|---|---|---|---|---|
0 |
12980 |
27 |
813 |
212.8 |
23.26 |
Amino acid frequency
Ala |
Cys |
Asp |
Glu |
Phe |
Gly |
His |
Ile |
Lys |
Leu |
|---|---|---|---|---|---|---|---|---|---|
11.048 ± 0.373 | 1.133 ± 0.141 |
6.333 ± 0.265 | 5.77 ± 0.372 |
3.451 ± 0.23 | 8.544 ± 0.433 |
1.579 ± 0.152 | 5.27 ± 0.209 |
4.954 ± 0.335 | 7.612 ± 0.232 |
Met |
Asn |
Gln |
Pro |
Arg |
Ser |
Thr |
Val |
Trp |
Tyr |
|---|---|---|---|---|---|---|---|---|---|
2.427 ± 0.173 | 4.445 ± 0.222 |
4.561 ± 0.25 | 4.099 ± 0.248 |
5.763 ± 0.36 | 5.524 ± 0.279 |
6.425 ± 0.445 | 6.672 ± 0.323 |
1.81 ± 0.166 | 2.581 ± 0.167 |
Most of the basic statistics you can see at this page can be downloaded from this CSV file
See this proteome in:

Proteome-pI is available under Creative Commons Attribution-NoDerivs license, for more details see here
| Reference: Kozlowski LP. Proteome-pI 2.0: Proteome Isoelectric Point Database Update. Nucleic Acids Res. 2021, doi: 10.1093/nar/gkab944 | Contact: Lukasz P. Kozlowski |