Georgenia sp. Z446
Taxonomy: cellular organisms; Bacteria; Terrabacteria group; Actinobacteria; Actinomycetia; Micrococcales; Bogoriellaceae; Georgenia; unclassified Georgenia
Average proteome isoelectric point is 6.2
Get precalculated fractions of proteins
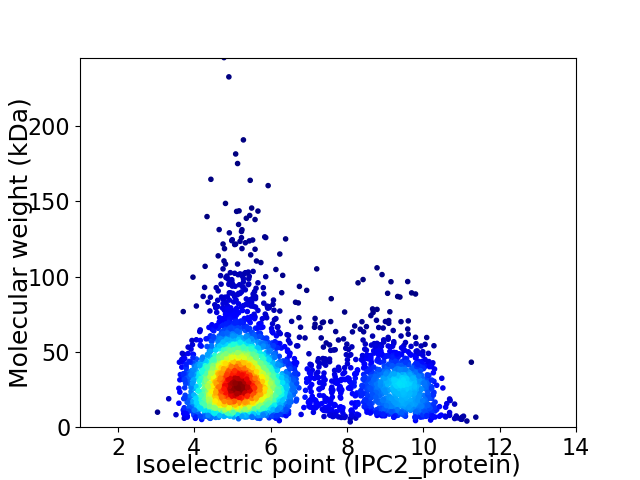
Virtual 2D-PAGE plot for 3886 proteins (isoelectric point calculated using IPC2_protein)
Get csv file with sequences according to given criteria:
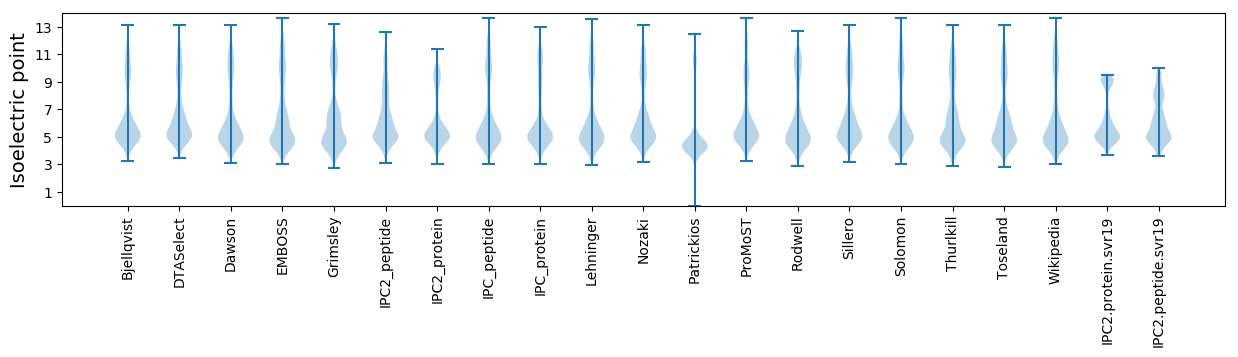
* You can choose from 21 different methods for calculating isoelectric point
Summary statistics related to proteome-wise predictions
Protein with the lowest isoelectric point:
>tr|A0A552WQ72|A0A552WQ72_9MICO DUF3516 domain-containing protein OS=Georgenia sp. Z446 OX=2594180 GN=FJ693_12860 PE=4 SV=1
MM1 pKa = 7.54EE2 pKa = 4.46FHH4 pKa = 6.24VTLSRR9 pKa = 11.84PVAAVATAAAALLALAACSSGGSAEE34 pKa = 4.14EE35 pKa = 4.5APASAATAGEE45 pKa = 4.18PAPVTIQHH53 pKa = 6.72AFGSTTIPEE62 pKa = 4.02QPEE65 pKa = 4.11NVVTLGWGSTEE76 pKa = 3.58AALALGVVPLGIEE89 pKa = 4.16SQTYY93 pKa = 9.51AADD96 pKa = 3.55EE97 pKa = 4.71HH98 pKa = 6.74GQLPWVAEE106 pKa = 4.03ALTDD110 pKa = 3.95AGAEE114 pKa = 4.06PTMLPATVEE123 pKa = 4.17EE124 pKa = 4.33PAYY127 pKa = 9.7EE128 pKa = 4.12QIGALAPDD136 pKa = 5.85LILAPYY142 pKa = 10.03SGITAEE148 pKa = 4.09QYY150 pKa = 10.81EE151 pKa = 4.96LLSEE155 pKa = 4.5IAPTVAYY162 pKa = 9.57PEE164 pKa = 4.67EE165 pKa = 4.63PWTTPWRR172 pKa = 11.84DD173 pKa = 3.18VITTVGTALGVPDD186 pKa = 4.82KK187 pKa = 11.35ADD189 pKa = 3.62TLVGDD194 pKa = 4.89LDD196 pKa = 3.9AQITEE201 pKa = 4.31AAQAHH206 pKa = 6.9PEE208 pKa = 4.02LAGKK212 pKa = 7.6TVAAVWDD219 pKa = 4.05LSGTFYY225 pKa = 10.98VYY227 pKa = 10.52KK228 pKa = 10.6AQDD231 pKa = 3.29SRR233 pKa = 11.84VDD235 pKa = 3.85FLLDD239 pKa = 3.84LGLVSAPAVDD249 pKa = 4.53EE250 pKa = 4.34LATDD254 pKa = 3.78EE255 pKa = 4.38EE256 pKa = 5.39SFVYY260 pKa = 9.89TLSTEE265 pKa = 3.92EE266 pKa = 4.06TDD268 pKa = 5.25RR269 pKa = 11.84LDD271 pKa = 4.1SDD273 pKa = 3.65ILVNYY278 pKa = 10.11ASTQEE283 pKa = 4.12EE284 pKa = 4.71VDD286 pKa = 3.58TFLGKK291 pKa = 10.23SYY293 pKa = 10.79AQAIPAVQAGAVANITGDD311 pKa = 3.55QLIAAMSPPTALSIDD326 pKa = 3.75WGLDD330 pKa = 3.11TYY332 pKa = 11.94VDD334 pKa = 4.49LLSKK338 pKa = 10.7AAATVKK344 pKa = 10.7
MM1 pKa = 7.54EE2 pKa = 4.46FHH4 pKa = 6.24VTLSRR9 pKa = 11.84PVAAVATAAAALLALAACSSGGSAEE34 pKa = 4.14EE35 pKa = 4.5APASAATAGEE45 pKa = 4.18PAPVTIQHH53 pKa = 6.72AFGSTTIPEE62 pKa = 4.02QPEE65 pKa = 4.11NVVTLGWGSTEE76 pKa = 3.58AALALGVVPLGIEE89 pKa = 4.16SQTYY93 pKa = 9.51AADD96 pKa = 3.55EE97 pKa = 4.71HH98 pKa = 6.74GQLPWVAEE106 pKa = 4.03ALTDD110 pKa = 3.95AGAEE114 pKa = 4.06PTMLPATVEE123 pKa = 4.17EE124 pKa = 4.33PAYY127 pKa = 9.7EE128 pKa = 4.12QIGALAPDD136 pKa = 5.85LILAPYY142 pKa = 10.03SGITAEE148 pKa = 4.09QYY150 pKa = 10.81EE151 pKa = 4.96LLSEE155 pKa = 4.5IAPTVAYY162 pKa = 9.57PEE164 pKa = 4.67EE165 pKa = 4.63PWTTPWRR172 pKa = 11.84DD173 pKa = 3.18VITTVGTALGVPDD186 pKa = 4.82KK187 pKa = 11.35ADD189 pKa = 3.62TLVGDD194 pKa = 4.89LDD196 pKa = 3.9AQITEE201 pKa = 4.31AAQAHH206 pKa = 6.9PEE208 pKa = 4.02LAGKK212 pKa = 7.6TVAAVWDD219 pKa = 4.05LSGTFYY225 pKa = 10.98VYY227 pKa = 10.52KK228 pKa = 10.6AQDD231 pKa = 3.29SRR233 pKa = 11.84VDD235 pKa = 3.85FLLDD239 pKa = 3.84LGLVSAPAVDD249 pKa = 4.53EE250 pKa = 4.34LATDD254 pKa = 3.78EE255 pKa = 4.38EE256 pKa = 5.39SFVYY260 pKa = 9.89TLSTEE265 pKa = 3.92EE266 pKa = 4.06TDD268 pKa = 5.25RR269 pKa = 11.84LDD271 pKa = 4.1SDD273 pKa = 3.65ILVNYY278 pKa = 10.11ASTQEE283 pKa = 4.12EE284 pKa = 4.71VDD286 pKa = 3.58TFLGKK291 pKa = 10.23SYY293 pKa = 10.79AQAIPAVQAGAVANITGDD311 pKa = 3.55QLIAAMSPPTALSIDD326 pKa = 3.75WGLDD330 pKa = 3.11TYY332 pKa = 11.94VDD334 pKa = 4.49LLSKK338 pKa = 10.7AAATVKK344 pKa = 10.7
Molecular weight: 35.72 kDa
Isoelectric point according different methods:
Protein with the highest isoelectric point:
>tr|A0A552WKS0|A0A552WKS0_9MICO Branched-chain amino acid ABC transporter OS=Georgenia sp. Z446 OX=2594180 GN=FJ693_18340 PE=4 SV=1
MM1 pKa = 7.53GLLPGPGGRR10 pKa = 11.84RR11 pKa = 11.84AHH13 pKa = 5.64QAAAHH18 pKa = 6.36RR19 pKa = 11.84SGAARR24 pKa = 11.84AALGGVRR31 pKa = 11.84ARR33 pKa = 11.84VQRR36 pKa = 11.84RR37 pKa = 11.84PAGGRR42 pKa = 11.84RR43 pKa = 11.84RR44 pKa = 11.84AAGRR48 pKa = 11.84GTGRR52 pKa = 11.84APRR55 pKa = 11.84PSGGATPGAGGRR67 pKa = 11.84GAA69 pKa = 4.39
MM1 pKa = 7.53GLLPGPGGRR10 pKa = 11.84RR11 pKa = 11.84AHH13 pKa = 5.64QAAAHH18 pKa = 6.36RR19 pKa = 11.84SGAARR24 pKa = 11.84AALGGVRR31 pKa = 11.84ARR33 pKa = 11.84VQRR36 pKa = 11.84RR37 pKa = 11.84PAGGRR42 pKa = 11.84RR43 pKa = 11.84RR44 pKa = 11.84AAGRR48 pKa = 11.84GTGRR52 pKa = 11.84APRR55 pKa = 11.84PSGGATPGAGGRR67 pKa = 11.84GAA69 pKa = 4.39
Molecular weight: 6.68 kDa
Isoelectric point according different methods:
Peptides (in silico digests for buttom-up proteomics)
Below you can find in silico digests of the whole proteome with Trypsin, Chymotrypsin, Trypsin+LysC, LysN, ArgC proteases suitable for different mass spec machines.| Try ESI |
 |
|---|
| ChTry ESI |
|
|---|
| ArgC ESI |
|
|---|
| LysN ESI |
|
|---|
| TryLysC ESI |
|
|---|
| Try MALDI |
|
|---|
| ChTry MALDI |
|
|---|
| ArgC MALDI |
|
|---|
| LysN MALDI |
|
|---|
| TryLysC MALDI |
|
|---|
| Try LTQ |
|
|---|
| ChTry LTQ |
|
|---|
| ArgC LTQ |
|
|---|
| LysN LTQ |
|
|---|
| TryLysC LTQ |
|
|---|
| Try MSlow |
|
|---|
| ChTry MSlow |
|
|---|
| ArgC MSlow |
|
|---|
| LysN MSlow |
|
|---|
| TryLysC MSlow |
|
|---|
| Try MShigh |
|
|---|
| ChTry MShigh |
|
|---|
| ArgC MShigh |
|
|---|
| LysN MShigh |
|
|---|
| TryLysC MShigh |
|
|---|
General Statistics
Number of major isoforms |
Number of additional isoforms |
Number of all proteins |
Number of amino acids |
Min. Seq. Length |
Max. Seq. Length |
Avg. Seq. Length |
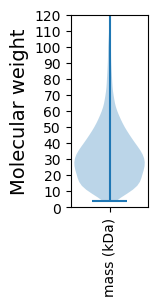
Avg. Mol. Weight |
|---|---|---|---|---|---|---|---|
0 |
1259739 |
32 |
2336 |
324.2 |
34.46 |
Amino acid frequency
Ala |
Cys |
Asp |
Glu |
Phe |
Gly |
His |
Ile |
Lys |
Leu |
|---|---|---|---|---|---|---|---|---|---|
14.37 ± 0.061 | 0.569 ± 0.009 |
6.054 ± 0.033 | 5.577 ± 0.033 |
2.615 ± 0.021 | 9.423 ± 0.039 |
2.202 ± 0.018 | 3.306 ± 0.03 |
1.636 ± 0.022 | 10.317 ± 0.045 |
Met |
Asn |
Gln |
Pro |
Arg |
Ser |
Thr |
Val |
Trp |
Tyr |
|---|---|---|---|---|---|---|---|---|---|
1.83 ± 0.015 | 1.678 ± 0.02 |
5.854 ± 0.03 | 2.732 ± 0.019 |
7.797 ± 0.046 | 4.757 ± 0.024 |
6.301 ± 0.027 | 9.656 ± 0.041 |
1.476 ± 0.016 | 1.851 ± 0.016 |
Most of the basic statistics you can see at this page can be downloaded from this CSV file
See this proteome in:

Proteome-pI is available under Creative Commons Attribution-NoDerivs license, for more details see here
| Reference: Kozlowski LP. Proteome-pI 2.0: Proteome Isoelectric Point Database Update. Nucleic Acids Res. 2021, doi: 10.1093/nar/gkab944 | Contact: Lukasz P. Kozlowski |