Streptococcus satellite phage Javan726
Taxonomy: Viruses; unclassified bacterial viruses
Average proteome isoelectric point is 6.6
Get precalculated fractions of proteins
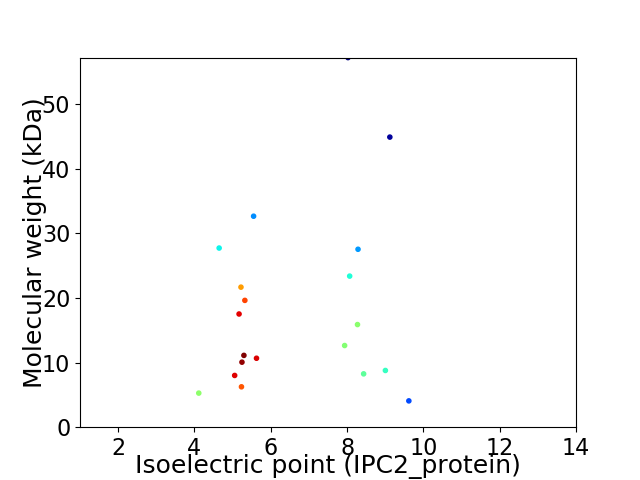
Virtual 2D-PAGE plot for 20 proteins (isoelectric point calculated using IPC2_protein)
Get csv file with sequences according to given criteria:
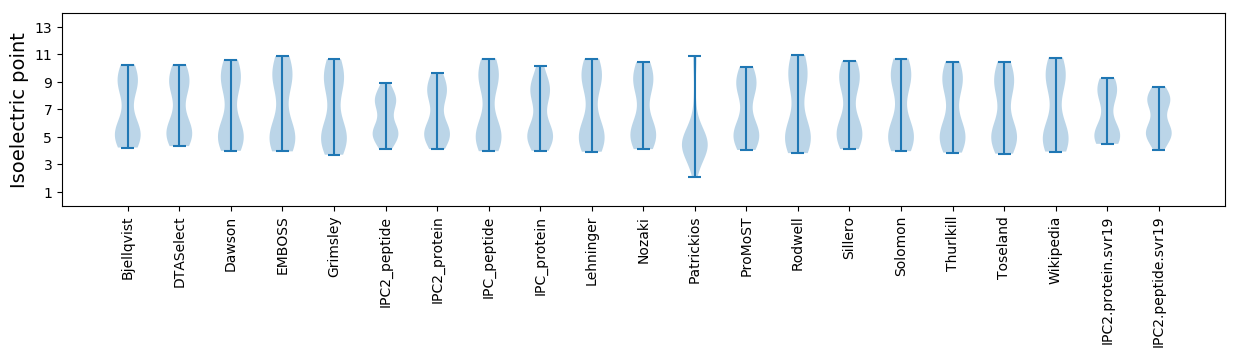
* You can choose from 21 different methods for calculating isoelectric point
Summary statistics related to proteome-wise predictions
Protein with the lowest isoelectric point:
>tr|A0A4D5ZTX0|A0A4D5ZTX0_9VIRU Uncharacterized protein OS=Streptococcus satellite phage Javan726 OX=2558820 GN=JavanS726_0018 PE=4 SV=1
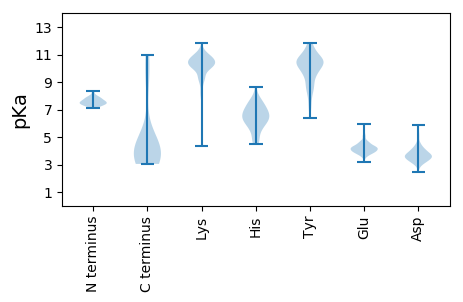
MM1 pKa = 7.22TLDD4 pKa = 4.01LGKK7 pKa = 8.39MTQAEE12 pKa = 4.45FDD14 pKa = 3.72EE15 pKa = 4.66VMADD19 pKa = 3.21IKK21 pKa = 11.13ARR23 pKa = 11.84NPNLLQLITDD33 pKa = 4.52FLDD36 pKa = 3.62RR37 pKa = 11.84KK38 pKa = 8.24VTPEE42 pKa = 4.05EE43 pKa = 3.86VDD45 pKa = 3.54DD46 pKa = 4.24
MM1 pKa = 7.22TLDD4 pKa = 4.01LGKK7 pKa = 8.39MTQAEE12 pKa = 4.45FDD14 pKa = 3.72EE15 pKa = 4.66VMADD19 pKa = 3.21IKK21 pKa = 11.13ARR23 pKa = 11.84NPNLLQLITDD33 pKa = 4.52FLDD36 pKa = 3.62RR37 pKa = 11.84KK38 pKa = 8.24VTPEE42 pKa = 4.05EE43 pKa = 3.86VDD45 pKa = 3.54DD46 pKa = 4.24
Molecular weight: 5.28 kDa
Isoelectric point according different methods:
Protein with the highest isoelectric point:
>tr|A0A4D5ZUC1|A0A4D5ZUC1_9VIRU Integrase OS=Streptococcus satellite phage Javan726 OX=2558820 GN=JavanS726_0001 PE=3 SV=1
MM1 pKa = 7.12MPKK4 pKa = 10.19SNYY7 pKa = 9.53RR8 pKa = 11.84EE9 pKa = 3.74MRR11 pKa = 11.84FISSLGEE18 pKa = 3.68KK19 pKa = 10.38LLATRR24 pKa = 11.84ILFTVTIANNQQ35 pKa = 3.18
MM1 pKa = 7.12MPKK4 pKa = 10.19SNYY7 pKa = 9.53RR8 pKa = 11.84EE9 pKa = 3.74MRR11 pKa = 11.84FISSLGEE18 pKa = 3.68KK19 pKa = 10.38LLATRR24 pKa = 11.84ILFTVTIANNQQ35 pKa = 3.18
Molecular weight: 4.07 kDa
Isoelectric point according different methods:
Peptides (in silico digests for buttom-up proteomics)
Below you can find in silico digests of the whole proteome with Trypsin, Chymotrypsin, Trypsin+LysC, LysN, ArgC proteases suitable for different mass spec machines.| Try ESI |
 |
|---|
| ChTry ESI |
|
|---|
| ArgC ESI |
|
|---|
| LysN ESI |
|
|---|
| TryLysC ESI |
|
|---|
| Try MALDI |
|
|---|
| ChTry MALDI |
|
|---|
| ArgC MALDI |
|
|---|
| LysN MALDI |
|
|---|
| TryLysC MALDI |
|
|---|
| Try LTQ |
|
|---|
| ChTry LTQ |
|
|---|
| ArgC LTQ |
|
|---|
| LysN LTQ |
|
|---|
| TryLysC LTQ |
|
|---|
| Try MSlow |
|
|---|
| ChTry MSlow |
|
|---|
| ArgC MSlow |
|
|---|
| LysN MSlow |
|
|---|
| TryLysC MSlow |
|
|---|
| Try MShigh |
|
|---|
| ChTry MShigh |
|
|---|
| ArgC MShigh |
|
|---|
| LysN MShigh |
|
|---|
| TryLysC MShigh |
|
|---|
General Statistics
Number of major isoforms |
Number of additional isoforms |
Number of all proteins |
Number of amino acids |
Min. Seq. Length |
Max. Seq. Length |
Avg. Seq. Length |
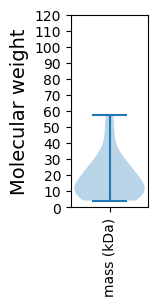
Avg. Mol. Weight |
|---|---|---|---|---|---|---|---|
0 |
3213 |
35 |
484 |
160.7 |
18.67 |
Amino acid frequency
Ala |
Cys |
Asp |
Glu |
Phe |
Gly |
His |
Ile |
Lys |
Leu |
|---|---|---|---|---|---|---|---|---|---|
4.918 ± 0.362 | 0.778 ± 0.148 |
6.256 ± 0.564 | 8.901 ± 0.626 |
4.606 ± 0.463 | 4.7 ± 0.4 |
1.556 ± 0.26 | 6.723 ± 0.492 |
9.773 ± 0.584 | 10.24 ± 0.592 |
Met |
Asn |
Gln |
Pro |
Arg |
Ser |
Thr |
Val |
Trp |
Tyr |
|---|---|---|---|---|---|---|---|---|---|
2.334 ± 0.266 | 5.571 ± 0.315 |
2.552 ± 0.239 | 3.268 ± 0.422 |
5.602 ± 0.424 | 5.54 ± 0.48 |
5.727 ± 0.425 | 5.727 ± 0.434 |
0.654 ± 0.124 | 4.575 ± 0.296 |
Most of the basic statistics you can see at this page can be downloaded from this CSV file
See this proteome in:

Proteome-pI is available under Creative Commons Attribution-NoDerivs license, for more details see here
| Reference: Kozlowski LP. Proteome-pI 2.0: Proteome Isoelectric Point Database Update. Nucleic Acids Res. 2021, doi: 10.1093/nar/gkab944 | Contact: Lukasz P. Kozlowski |