Streptococcus satellite phage Javan727
Taxonomy: Viruses; unclassified bacterial viruses
Average proteome isoelectric point is 6.96
Get precalculated fractions of proteins
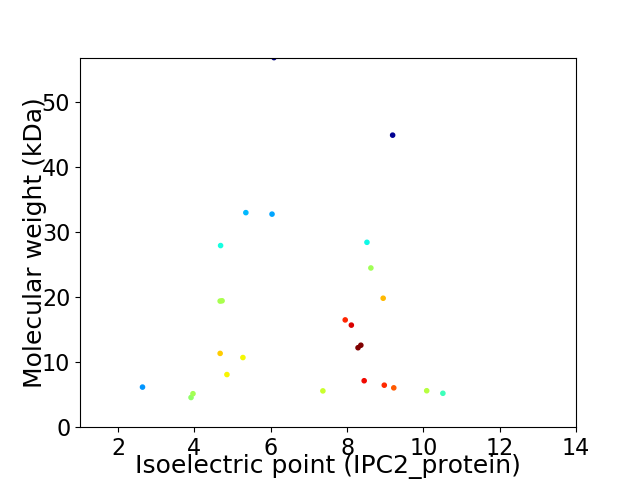
Virtual 2D-PAGE plot for 26 proteins (isoelectric point calculated using IPC2_protein)
Get csv file with sequences according to given criteria:
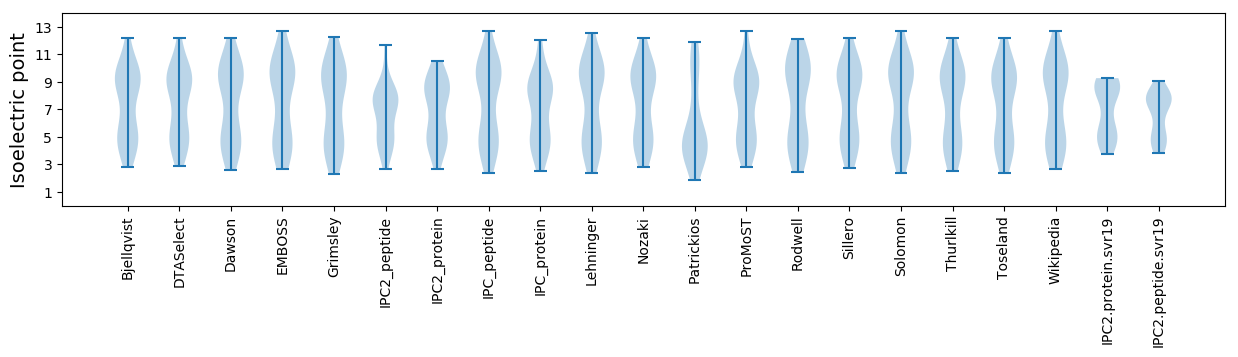
* You can choose from 21 different methods for calculating isoelectric point
Summary statistics related to proteome-wise predictions
Protein with the lowest isoelectric point:
>tr|A0A4D5ZUW6|A0A4D5ZUW6_9VIRU Uncharacterized protein OS=Streptococcus satellite phage Javan727 OX=2558821 GN=JavanS727_0023 PE=4 SV=1
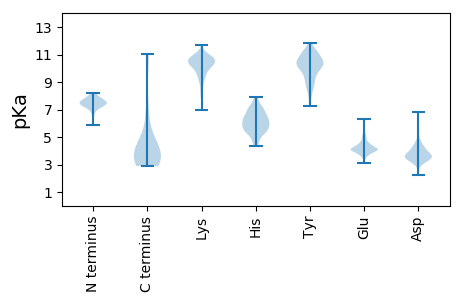
MM1 pKa = 7.87EE2 pKa = 4.51EE3 pKa = 3.56TTYY6 pKa = 11.03DD7 pKa = 3.82IIAKK11 pKa = 9.74SLDD14 pKa = 4.0RR15 pKa = 11.84ISMEE19 pKa = 3.74LHH21 pKa = 5.91QADD24 pKa = 4.33EE25 pKa = 4.59NNDD28 pKa = 3.14FLEE31 pKa = 4.3YY32 pKa = 10.95GFYY35 pKa = 10.31QDD37 pKa = 3.87NN38 pKa = 3.58
MM1 pKa = 7.87EE2 pKa = 4.51EE3 pKa = 3.56TTYY6 pKa = 11.03DD7 pKa = 3.82IIAKK11 pKa = 9.74SLDD14 pKa = 4.0RR15 pKa = 11.84ISMEE19 pKa = 3.74LHH21 pKa = 5.91QADD24 pKa = 4.33EE25 pKa = 4.59NNDD28 pKa = 3.14FLEE31 pKa = 4.3YY32 pKa = 10.95GFYY35 pKa = 10.31QDD37 pKa = 3.87NN38 pKa = 3.58
Molecular weight: 4.56 kDa
Isoelectric point according different methods:
Protein with the highest isoelectric point:
>tr|A0A4D5ZUW0|A0A4D5ZUW0_9VIRU Uncharacterized protein OS=Streptococcus satellite phage Javan727 OX=2558821 GN=JavanS727_0016 PE=4 SV=1
MM1 pKa = 7.38GKK3 pKa = 9.59SATNMKK9 pKa = 10.18RR10 pKa = 11.84IATIFLLGLPKK21 pKa = 9.96VPKK24 pKa = 8.88MRR26 pKa = 11.84PIAYY30 pKa = 8.55PRR32 pKa = 11.84ATISNNPEE40 pKa = 3.14ARR42 pKa = 11.84GIYY45 pKa = 10.11LEE47 pKa = 4.06NKK49 pKa = 9.02KK50 pKa = 10.62
MM1 pKa = 7.38GKK3 pKa = 9.59SATNMKK9 pKa = 10.18RR10 pKa = 11.84IATIFLLGLPKK21 pKa = 9.96VPKK24 pKa = 8.88MRR26 pKa = 11.84PIAYY30 pKa = 8.55PRR32 pKa = 11.84ATISNNPEE40 pKa = 3.14ARR42 pKa = 11.84GIYY45 pKa = 10.11LEE47 pKa = 4.06NKK49 pKa = 9.02KK50 pKa = 10.62
Molecular weight: 5.6 kDa
Isoelectric point according different methods:
Peptides (in silico digests for buttom-up proteomics)
Below you can find in silico digests of the whole proteome with Trypsin, Chymotrypsin, Trypsin+LysC, LysN, ArgC proteases suitable for different mass spec machines.| Try ESI |
 |
|---|
| ChTry ESI |
|
|---|
| ArgC ESI |
|
|---|
| LysN ESI |
|
|---|
| TryLysC ESI |
|
|---|
| Try MALDI |
|
|---|
| ChTry MALDI |
|
|---|
| ArgC MALDI |
|
|---|
| LysN MALDI |
|
|---|
| TryLysC MALDI |
|
|---|
| Try LTQ |
|
|---|
| ChTry LTQ |
|
|---|
| ArgC LTQ |
|
|---|
| LysN LTQ |
|
|---|
| TryLysC LTQ |
|
|---|
| Try MSlow |
|
|---|
| ChTry MSlow |
|
|---|
| ArgC MSlow |
|
|---|
| LysN MSlow |
|
|---|
| TryLysC MSlow |
|
|---|
| Try MShigh |
|
|---|
| ChTry MShigh |
|
|---|
| ArgC MShigh |
|
|---|
| LysN MShigh |
|
|---|
| TryLysC MShigh |
|
|---|
General Statistics
Number of major isoforms |
Number of additional isoforms |
Number of all proteins |
Number of amino acids |
Min. Seq. Length |
Max. Seq. Length |
Avg. Seq. Length |
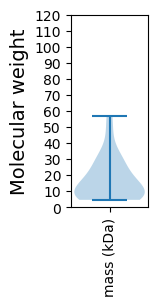
Avg. Mol. Weight |
|---|---|---|---|---|---|---|---|
0 |
3851 |
38 |
492 |
148.1 |
17.14 |
Amino acid frequency
Ala |
Cys |
Asp |
Glu |
Phe |
Gly |
His |
Ile |
Lys |
Leu |
|---|---|---|---|---|---|---|---|---|---|
5.375 ± 0.21 | 0.831 ± 0.161 |
5.895 ± 0.451 | 8.517 ± 0.533 |
4.051 ± 0.288 | 5.09 ± 0.327 |
1.532 ± 0.225 | 6.57 ± 0.4 |
9.14 ± 0.528 | 9.894 ± 0.478 |
Met |
Asn |
Gln |
Pro |
Arg |
Ser |
Thr |
Val |
Trp |
Tyr |
|---|---|---|---|---|---|---|---|---|---|
2.856 ± 0.3 | 5.635 ± 0.468 |
3.376 ± 0.465 | 3.973 ± 0.319 |
5.505 ± 0.379 | 5.09 ± 0.4 |
6.388 ± 0.339 | 5.012 ± 0.366 |
0.857 ± 0.168 | 4.414 ± 0.328 |
Most of the basic statistics you can see at this page can be downloaded from this CSV file
See this proteome in:

Proteome-pI is available under Creative Commons Attribution-NoDerivs license, for more details see here
| Reference: Kozlowski LP. Proteome-pI 2.0: Proteome Isoelectric Point Database Update. Nucleic Acids Res. 2021, doi: 10.1093/nar/gkab944 | Contact: Lukasz P. Kozlowski |