Streptococcus satellite phage Javan342
Taxonomy: Viruses; Duplodnaviria; Heunggongvirae; Uroviricota; Caudoviricetes; Caudovirales; Siphoviridae; unclassified Siphoviridae
Average proteome isoelectric point is 6.83
Get precalculated fractions of proteins
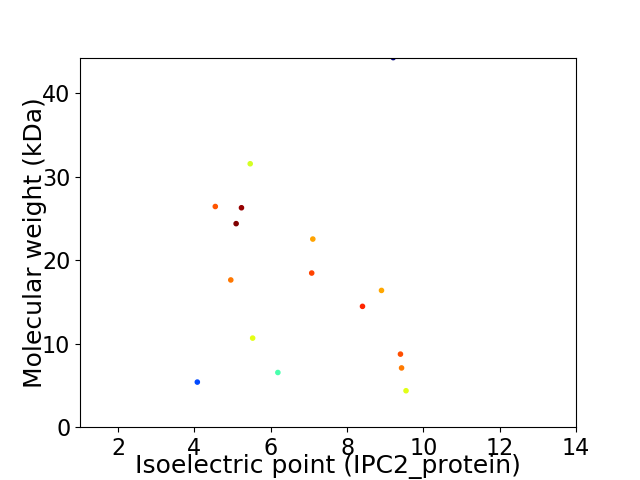
Virtual 2D-PAGE plot for 16 proteins (isoelectric point calculated using IPC2_protein)
Get csv file with sequences according to given criteria:
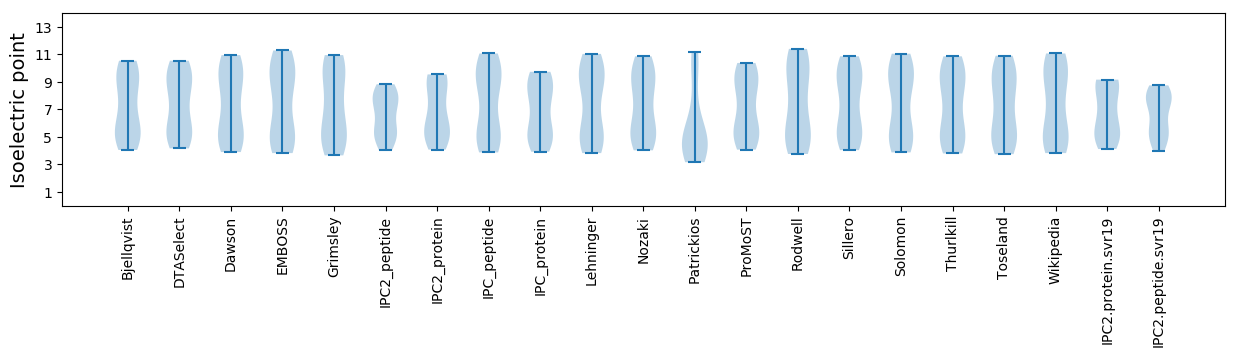
* You can choose from 21 different methods for calculating isoelectric point
Summary statistics related to proteome-wise predictions
Protein with the lowest isoelectric point:
>tr|A0A4D5ZMD9|A0A4D5ZMD9_9VIRU Putative transcription regulator OS=Streptococcus satellite phage Javan342 OX=2558650 GN=JavanS342_0015 PE=4 SV=1
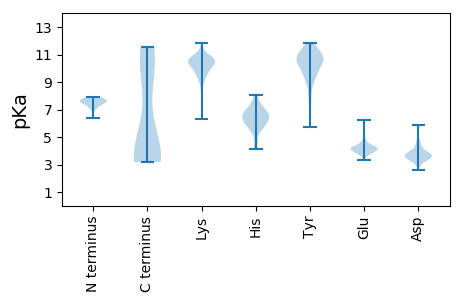
MM1 pKa = 7.75EE2 pKa = 4.87IVIFDD7 pKa = 3.76SAKK10 pKa = 10.72EE11 pKa = 3.78LDD13 pKa = 3.63LDD15 pKa = 3.94AFYY18 pKa = 11.32SEE20 pKa = 4.39YY21 pKa = 11.12LDD23 pKa = 3.62VLFISNQVDD32 pKa = 3.52EE33 pKa = 4.71EE34 pKa = 4.2TRR36 pKa = 11.84AAIIEE41 pKa = 4.53CYY43 pKa = 10.07KK44 pKa = 10.61KK45 pKa = 10.43QQ46 pKa = 3.26
MM1 pKa = 7.75EE2 pKa = 4.87IVIFDD7 pKa = 3.76SAKK10 pKa = 10.72EE11 pKa = 3.78LDD13 pKa = 3.63LDD15 pKa = 3.94AFYY18 pKa = 11.32SEE20 pKa = 4.39YY21 pKa = 11.12LDD23 pKa = 3.62VLFISNQVDD32 pKa = 3.52EE33 pKa = 4.71EE34 pKa = 4.2TRR36 pKa = 11.84AAIIEE41 pKa = 4.53CYY43 pKa = 10.07KK44 pKa = 10.61KK45 pKa = 10.43QQ46 pKa = 3.26
Molecular weight: 5.41 kDa
Isoelectric point according different methods:
Protein with the highest isoelectric point:
>tr|A0A4D5ZK50|A0A4D5ZK50_9VIRU Integrase/recombinase OS=Streptococcus satellite phage Javan342 OX=2558650 GN=JavanS342_0001 PE=3 SV=1
MM1 pKa = 7.62QEE3 pKa = 3.68LHH5 pKa = 6.17KK6 pKa = 9.77TNTSQVEE13 pKa = 4.2GSLSILSDD21 pKa = 3.25VARR24 pKa = 11.84GKK26 pKa = 10.71RR27 pKa = 11.84EE28 pKa = 4.07LKK30 pKa = 10.06RR31 pKa = 11.84GKK33 pKa = 10.57AFGKK37 pKa = 10.47RR38 pKa = 11.84II39 pKa = 3.57
MM1 pKa = 7.62QEE3 pKa = 3.68LHH5 pKa = 6.17KK6 pKa = 9.77TNTSQVEE13 pKa = 4.2GSLSILSDD21 pKa = 3.25VARR24 pKa = 11.84GKK26 pKa = 10.71RR27 pKa = 11.84EE28 pKa = 4.07LKK30 pKa = 10.06RR31 pKa = 11.84GKK33 pKa = 10.57AFGKK37 pKa = 10.47RR38 pKa = 11.84II39 pKa = 3.57
Molecular weight: 4.37 kDa
Isoelectric point according different methods:
Peptides (in silico digests for buttom-up proteomics)
Below you can find in silico digests of the whole proteome with Trypsin, Chymotrypsin, Trypsin+LysC, LysN, ArgC proteases suitable for different mass spec machines.| Try ESI |
 |
|---|
| ChTry ESI |
|
|---|
| ArgC ESI |
|
|---|
| LysN ESI |
|
|---|
| TryLysC ESI |
|
|---|
| Try MALDI |
|
|---|
| ChTry MALDI |
|
|---|
| ArgC MALDI |
|
|---|
| LysN MALDI |
|
|---|
| TryLysC MALDI |
|
|---|
| Try LTQ |
|
|---|
| ChTry LTQ |
|
|---|
| ArgC LTQ |
|
|---|
| LysN LTQ |
|
|---|
| TryLysC LTQ |
|
|---|
| Try MSlow |
|
|---|
| ChTry MSlow |
|
|---|
| ArgC MSlow |
|
|---|
| LysN MSlow |
|
|---|
| TryLysC MSlow |
|
|---|
| Try MShigh |
|
|---|
| ChTry MShigh |
|
|---|
| ArgC MShigh |
|
|---|
| LysN MShigh |
|
|---|
| TryLysC MShigh |
|
|---|
General Statistics
Number of major isoforms |
Number of additional isoforms |
Number of all proteins |
Number of amino acids |
Min. Seq. Length |
Max. Seq. Length |
Avg. Seq. Length |
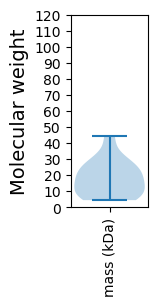
Avg. Mol. Weight |
|---|---|---|---|---|---|---|---|
0 |
2453 |
39 |
387 |
153.3 |
17.84 |
Amino acid frequency
Ala |
Cys |
Asp |
Glu |
Phe |
Gly |
His |
Ile |
Lys |
Leu |
|---|---|---|---|---|---|---|---|---|---|
6.074 ± 0.6 | 0.571 ± 0.13 |
6.033 ± 0.429 | 8.642 ± 0.857 |
3.465 ± 0.435 | 4.117 ± 0.303 |
1.631 ± 0.276 | 7.297 ± 0.534 |
10.069 ± 0.647 | 10.599 ± 0.939 |
Met |
Asn |
Gln |
Pro |
Arg |
Ser |
Thr |
Val |
Trp |
Tyr |
|---|---|---|---|---|---|---|---|---|---|
2.528 ± 0.242 | 5.503 ± 0.576 |
2.283 ± 0.198 | 4.77 ± 0.369 |
4.566 ± 0.347 | 5.463 ± 0.528 |
5.177 ± 0.589 | 5.055 ± 0.522 |
1.182 ± 0.182 | 4.974 ± 0.526 |
Most of the basic statistics you can see at this page can be downloaded from this CSV file
See this proteome in:

Proteome-pI is available under Creative Commons Attribution-NoDerivs license, for more details see here
| Reference: Kozlowski LP. Proteome-pI 2.0: Proteome Isoelectric Point Database Update. Nucleic Acids Res. 2021, doi: 10.1093/nar/gkab944 | Contact: Lukasz P. Kozlowski |