Serratia odorifera DSM 4582
Taxonomy: cellular organisms; Bacteria; Proteobacteria; Gammaproteobacteria; Enterobacterales; Yersiniaceae; Serratia; Serratia odorifera
Average proteome isoelectric point is 6.75
Get precalculated fractions of proteins
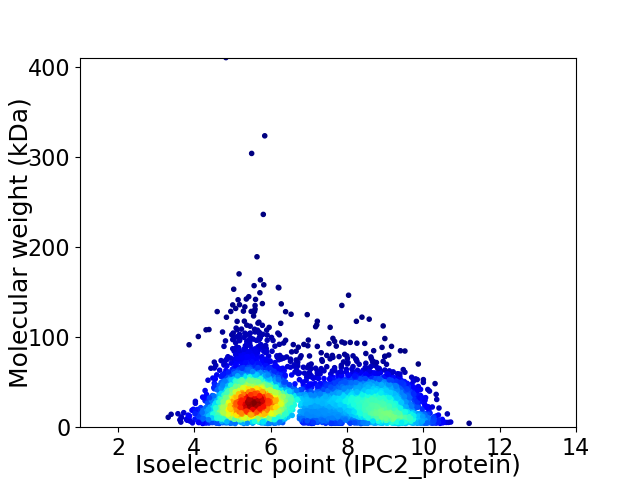
Virtual 2D-PAGE plot for 5121 proteins (isoelectric point calculated using IPC2_protein)
Get csv file with sequences according to given criteria:
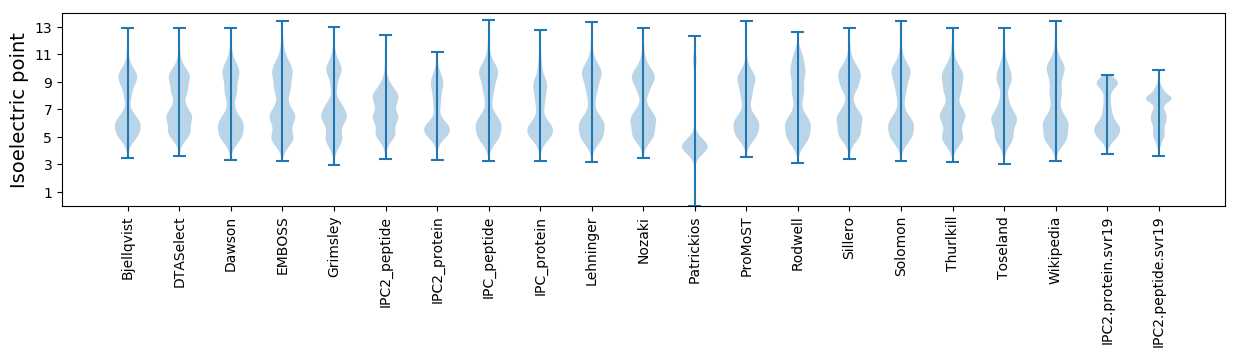
* You can choose from 21 different methods for calculating isoelectric point
Summary statistics related to proteome-wise predictions
Protein with the lowest isoelectric point:
>tr|D4E3H3|D4E3H3_SEROD Fatty acid oxidation complex subunit alpha OS=Serratia odorifera DSM 4582 OX=667129 GN=fadJ PE=3 SV=1
MM1 pKa = 8.18DD2 pKa = 4.43NTDD5 pKa = 3.4CTASYY10 pKa = 10.71SQVFTDD16 pKa = 3.76QQQAQQALAALTDD29 pKa = 3.43KK30 pKa = 11.12ARR32 pKa = 11.84AVEE35 pKa = 4.99SDD37 pKa = 3.27PCDD40 pKa = 3.31INSSINPVDD49 pKa = 3.88GGFQLDD55 pKa = 3.21VDD57 pKa = 6.34FIFCCQAEE65 pKa = 4.29TLIFQLGLRR74 pKa = 4.32
MM1 pKa = 8.18DD2 pKa = 4.43NTDD5 pKa = 3.4CTASYY10 pKa = 10.71SQVFTDD16 pKa = 3.76QQQAQQALAALTDD29 pKa = 3.43KK30 pKa = 11.12ARR32 pKa = 11.84AVEE35 pKa = 4.99SDD37 pKa = 3.27PCDD40 pKa = 3.31INSSINPVDD49 pKa = 3.88GGFQLDD55 pKa = 3.21VDD57 pKa = 6.34FIFCCQAEE65 pKa = 4.29TLIFQLGLRR74 pKa = 4.32
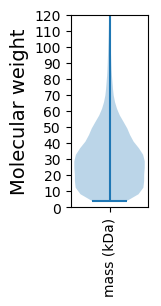
Molecular weight: 8.09 kDa
Isoelectric point according different methods:
Protein with the highest isoelectric point:
>tr|D4E049|D4E049_SEROD Homoserine/Threonine efflux protein OS=Serratia odorifera DSM 4582 OX=667129 GN=rhtB2 PE=4 SV=1
MM1 pKa = 7.31KK2 pKa = 10.17RR3 pKa = 11.84NRR5 pKa = 11.84SHH7 pKa = 7.03GFRR10 pKa = 11.84ARR12 pKa = 11.84MATKK16 pKa = 10.4NGRR19 pKa = 11.84QVLARR24 pKa = 11.84RR25 pKa = 11.84RR26 pKa = 11.84AKK28 pKa = 10.41GRR30 pKa = 11.84TRR32 pKa = 11.84LSVSKK37 pKa = 10.96
MM1 pKa = 7.31KK2 pKa = 10.17RR3 pKa = 11.84NRR5 pKa = 11.84SHH7 pKa = 7.03GFRR10 pKa = 11.84ARR12 pKa = 11.84MATKK16 pKa = 10.4NGRR19 pKa = 11.84QVLARR24 pKa = 11.84RR25 pKa = 11.84RR26 pKa = 11.84AKK28 pKa = 10.41GRR30 pKa = 11.84TRR32 pKa = 11.84LSVSKK37 pKa = 10.96
Molecular weight: 4.34 kDa
Isoelectric point according different methods:
Peptides (in silico digests for buttom-up proteomics)
Below you can find in silico digests of the whole proteome with Trypsin, Chymotrypsin, Trypsin+LysC, LysN, ArgC proteases suitable for different mass spec machines.| Try ESI |
 |
|---|
| ChTry ESI |
|
|---|
| ArgC ESI |
|
|---|
| LysN ESI |
|
|---|
| TryLysC ESI |
|
|---|
| Try MALDI |
|
|---|
| ChTry MALDI |
|
|---|
| ArgC MALDI |
|
|---|
| LysN MALDI |
|
|---|
| TryLysC MALDI |
|
|---|
| Try LTQ |
|
|---|
| ChTry LTQ |
|
|---|
| ArgC LTQ |
|
|---|
| LysN LTQ |
|
|---|
| TryLysC LTQ |
|
|---|
| Try MSlow |
|
|---|
| ChTry MSlow |
|
|---|
| ArgC MSlow |
|
|---|
| LysN MSlow |
|
|---|
| TryLysC MSlow |
|
|---|
| Try MShigh |
|
|---|
| ChTry MShigh |
|
|---|
| ArgC MShigh |
|
|---|
| LysN MShigh |
|
|---|
| TryLysC MShigh |
|
|---|
General Statistics
Number of major isoforms |
Number of additional isoforms |
Number of all proteins |
Number of amino acids |
Min. Seq. Length |
Max. Seq. Length |
Avg. Seq. Length |
Avg. Mol. Weight |
|---|---|---|---|---|---|---|---|
0 |
1498009 |
31 |
3986 |
292.5 |
32.24 |
Amino acid frequency
Ala |
Cys |
Asp |
Glu |
Phe |
Gly |
His |
Ile |
Lys |
Leu |
|---|---|---|---|---|---|---|---|---|---|
10.44 ± 0.042 | 1.074 ± 0.013 |
5.16 ± 0.027 | 5.124 ± 0.034 |
3.757 ± 0.028 | 7.64 ± 0.035 |
2.26 ± 0.016 | 5.52 ± 0.034 |
3.805 ± 0.034 | 11.222 ± 0.043 |
Met |
Asn |
Gln |
Pro |
Arg |
Ser |
Thr |
Val |
Trp |
Tyr |
|---|---|---|---|---|---|---|---|---|---|
2.705 ± 0.016 | 3.543 ± 0.026 |
4.581 ± 0.024 | 5.091 ± 0.031 |
5.93 ± 0.032 | 5.821 ± 0.027 |
5.073 ± 0.025 | 6.955 ± 0.027 |
1.46 ± 0.017 | 2.837 ± 0.019 |
Most of the basic statistics you can see at this page can be downloaded from this CSV file
See this proteome in:

Proteome-pI is available under Creative Commons Attribution-NoDerivs license, for more details see here
| Reference: Kozlowski LP. Proteome-pI 2.0: Proteome Isoelectric Point Database Update. Nucleic Acids Res. 2021, doi: 10.1093/nar/gkab944 | Contact: Lukasz P. Kozlowski |