Thermomonospora echinospora
Taxonomy: cellular organisms; Bacteria; Terrabacteria group; Actinobacteria; Actinomycetia; Streptosporangiales; Thermomonosporaceae; Thermomonospora
Average proteome isoelectric point is 6.59
Get precalculated fractions of proteins
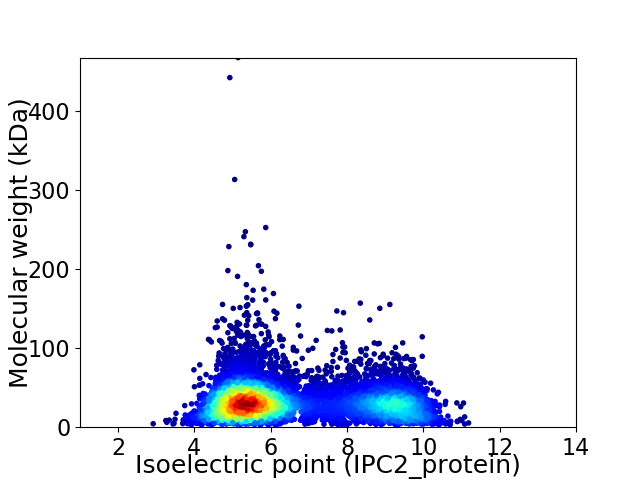
Virtual 2D-PAGE plot for 7946 proteins (isoelectric point calculated using IPC2_protein)
Get csv file with sequences according to given criteria:
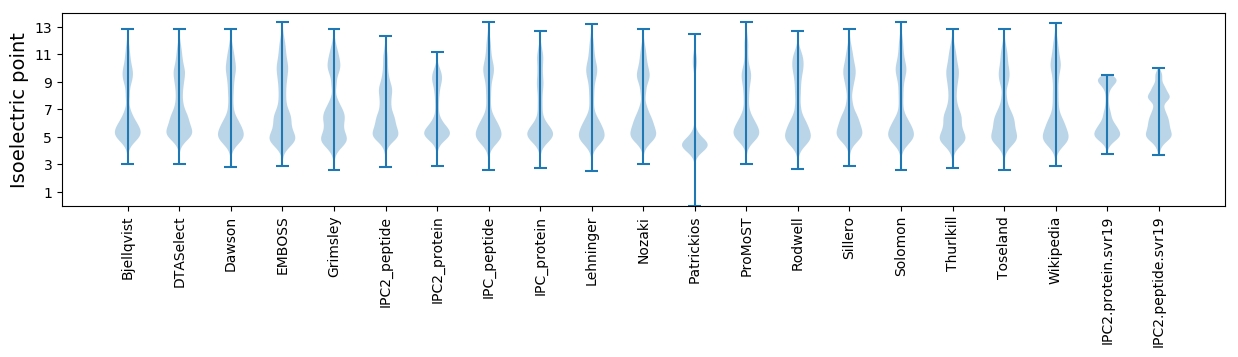
* You can choose from 21 different methods for calculating isoelectric point
Summary statistics related to proteome-wise predictions
Protein with the lowest isoelectric point:
>tr|A0A1H6D9Z9|A0A1H6D9Z9_9ACTN Transcriptional regulator contains XRE-family HTH domain OS=Thermomonospora echinospora OX=1992 GN=SAMN04489712_1157 PE=4 SV=1
MM1 pKa = 7.93PEE3 pKa = 3.73MTSYY7 pKa = 11.19EE8 pKa = 4.0PGEE11 pKa = 4.24PCWADD16 pKa = 3.46LASPDD21 pKa = 3.73PEE23 pKa = 4.13AAKK26 pKa = 10.6VFYY29 pKa = 10.69GGLFGWGSSTPADD42 pKa = 4.04PGFGGYY48 pKa = 8.07TSFTLGGVEE57 pKa = 3.91GDD59 pKa = 3.61EE60 pKa = 4.37VAGLMEE66 pKa = 5.82LMDD69 pKa = 4.34EE70 pKa = 4.34RR71 pKa = 11.84QPPAWTCYY79 pKa = 10.33ISVADD84 pKa = 4.26ADD86 pKa = 4.03EE87 pKa = 4.32TADD90 pKa = 3.54AVTAAGGQVYY100 pKa = 7.78TPPMDD105 pKa = 3.37VAGLGRR111 pKa = 11.84MAVFGDD117 pKa = 3.5SQGAVFGVWEE127 pKa = 4.7PGDD130 pKa = 3.33FAGARR135 pKa = 11.84RR136 pKa = 11.84VNEE139 pKa = 4.13PGALCWTEE147 pKa = 3.65LACRR151 pKa = 11.84DD152 pKa = 3.37IEE154 pKa = 4.2AAKK157 pKa = 10.49AFYY160 pKa = 10.53GSVIGWEE167 pKa = 4.53SVTEE171 pKa = 4.07PAGTTTYY178 pKa = 10.66TEE180 pKa = 3.93WTTDD184 pKa = 2.92GRR186 pKa = 11.84SIAGMVQMNEE196 pKa = 4.02EE197 pKa = 4.53WPDD200 pKa = 3.53DD201 pKa = 4.02APPYY205 pKa = 8.16WMPYY209 pKa = 9.44FAVEE213 pKa = 4.39DD214 pKa = 4.01CDD216 pKa = 3.83AAADD220 pKa = 3.86KK221 pKa = 10.94AVALGGRR228 pKa = 11.84VPVPPTDD235 pKa = 3.36IPPGRR240 pKa = 11.84FAVVADD246 pKa = 3.88PDD248 pKa = 3.89GAYY251 pKa = 10.78LSIIRR256 pKa = 11.84LTGG259 pKa = 3.14
MM1 pKa = 7.93PEE3 pKa = 3.73MTSYY7 pKa = 11.19EE8 pKa = 4.0PGEE11 pKa = 4.24PCWADD16 pKa = 3.46LASPDD21 pKa = 3.73PEE23 pKa = 4.13AAKK26 pKa = 10.6VFYY29 pKa = 10.69GGLFGWGSSTPADD42 pKa = 4.04PGFGGYY48 pKa = 8.07TSFTLGGVEE57 pKa = 3.91GDD59 pKa = 3.61EE60 pKa = 4.37VAGLMEE66 pKa = 5.82LMDD69 pKa = 4.34EE70 pKa = 4.34RR71 pKa = 11.84QPPAWTCYY79 pKa = 10.33ISVADD84 pKa = 4.26ADD86 pKa = 4.03EE87 pKa = 4.32TADD90 pKa = 3.54AVTAAGGQVYY100 pKa = 7.78TPPMDD105 pKa = 3.37VAGLGRR111 pKa = 11.84MAVFGDD117 pKa = 3.5SQGAVFGVWEE127 pKa = 4.7PGDD130 pKa = 3.33FAGARR135 pKa = 11.84RR136 pKa = 11.84VNEE139 pKa = 4.13PGALCWTEE147 pKa = 3.65LACRR151 pKa = 11.84DD152 pKa = 3.37IEE154 pKa = 4.2AAKK157 pKa = 10.49AFYY160 pKa = 10.53GSVIGWEE167 pKa = 4.53SVTEE171 pKa = 4.07PAGTTTYY178 pKa = 10.66TEE180 pKa = 3.93WTTDD184 pKa = 2.92GRR186 pKa = 11.84SIAGMVQMNEE196 pKa = 4.02EE197 pKa = 4.53WPDD200 pKa = 3.53DD201 pKa = 4.02APPYY205 pKa = 8.16WMPYY209 pKa = 9.44FAVEE213 pKa = 4.39DD214 pKa = 4.01CDD216 pKa = 3.83AAADD220 pKa = 3.86KK221 pKa = 10.94AVALGGRR228 pKa = 11.84VPVPPTDD235 pKa = 3.36IPPGRR240 pKa = 11.84FAVVADD246 pKa = 3.88PDD248 pKa = 3.89GAYY251 pKa = 10.78LSIIRR256 pKa = 11.84LTGG259 pKa = 3.14
Molecular weight: 27.34 kDa
Isoelectric point according different methods:
Protein with the highest isoelectric point:
>tr|A0A1H5VGX3|A0A1H5VGX3_9ACTN Helix-turn-helix OS=Thermomonospora echinospora OX=1992 GN=SAMN04489712_102322 PE=4 SV=1
MM1 pKa = 6.8SQKK4 pKa = 10.08SRR6 pKa = 11.84KK7 pKa = 7.98NRR9 pKa = 11.84RR10 pKa = 11.84TSARR14 pKa = 11.84TAPGRR19 pKa = 11.84RR20 pKa = 11.84SLTVRR25 pKa = 11.84IASGALGALAGGLAGRR41 pKa = 11.84ALRR44 pKa = 11.84PAARR48 pKa = 11.84QISRR52 pKa = 11.84RR53 pKa = 11.84LGVSAEE59 pKa = 3.85SMIRR63 pKa = 11.84VVEE66 pKa = 3.9ITAPVVASMAAGQLAARR83 pKa = 11.84GAARR87 pKa = 11.84NRR89 pKa = 11.84PHH91 pKa = 7.67RR92 pKa = 11.84ARR94 pKa = 11.84ILRR97 pKa = 11.84TRR99 pKa = 11.84TARR102 pKa = 11.84VRR104 pKa = 11.84GSGRR108 pKa = 11.84SRR110 pKa = 11.84LIPQHH115 pKa = 6.3PPSTASKK122 pKa = 10.34NN123 pKa = 3.52
MM1 pKa = 6.8SQKK4 pKa = 10.08SRR6 pKa = 11.84KK7 pKa = 7.98NRR9 pKa = 11.84RR10 pKa = 11.84TSARR14 pKa = 11.84TAPGRR19 pKa = 11.84RR20 pKa = 11.84SLTVRR25 pKa = 11.84IASGALGALAGGLAGRR41 pKa = 11.84ALRR44 pKa = 11.84PAARR48 pKa = 11.84QISRR52 pKa = 11.84RR53 pKa = 11.84LGVSAEE59 pKa = 3.85SMIRR63 pKa = 11.84VVEE66 pKa = 3.9ITAPVVASMAAGQLAARR83 pKa = 11.84GAARR87 pKa = 11.84NRR89 pKa = 11.84PHH91 pKa = 7.67RR92 pKa = 11.84ARR94 pKa = 11.84ILRR97 pKa = 11.84TRR99 pKa = 11.84TARR102 pKa = 11.84VRR104 pKa = 11.84GSGRR108 pKa = 11.84SRR110 pKa = 11.84LIPQHH115 pKa = 6.3PPSTASKK122 pKa = 10.34NN123 pKa = 3.52
Molecular weight: 13.03 kDa
Isoelectric point according different methods:
Peptides (in silico digests for buttom-up proteomics)
Below you can find in silico digests of the whole proteome with Trypsin, Chymotrypsin, Trypsin+LysC, LysN, ArgC proteases suitable for different mass spec machines.| Try ESI |
 |
|---|
| ChTry ESI |
|
|---|
| ArgC ESI |
|
|---|
| LysN ESI |
|
|---|
| TryLysC ESI |
|
|---|
| Try MALDI |
|
|---|
| ChTry MALDI |
|
|---|
| ArgC MALDI |
|
|---|
| LysN MALDI |
|
|---|
| TryLysC MALDI |
|
|---|
| Try LTQ |
|
|---|
| ChTry LTQ |
|
|---|
| ArgC LTQ |
|
|---|
| LysN LTQ |
|
|---|
| TryLysC LTQ |
|
|---|
| Try MSlow |
|
|---|
| ChTry MSlow |
|
|---|
| ArgC MSlow |
|
|---|
| LysN MSlow |
|
|---|
| TryLysC MSlow |
|
|---|
| Try MShigh |
|
|---|
| ChTry MShigh |
|
|---|
| ArgC MShigh |
|
|---|
| LysN MShigh |
|
|---|
| TryLysC MShigh |
|
|---|
General Statistics
Number of major isoforms |
Number of additional isoforms |
Number of all proteins |
Number of amino acids |
Min. Seq. Length |
Max. Seq. Length |
Avg. Seq. Length |
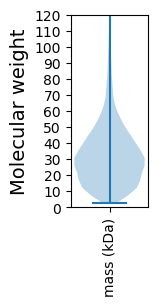
Avg. Mol. Weight |
|---|---|---|---|---|---|---|---|
0 |
2513009 |
25 |
4309 |
316.3 |
34.0 |
Amino acid frequency
Ala |
Cys |
Asp |
Glu |
Phe |
Gly |
His |
Ile |
Lys |
Leu |
|---|---|---|---|---|---|---|---|---|---|
13.414 ± 0.038 | 0.819 ± 0.008 |
5.901 ± 0.021 | 5.812 ± 0.022 |
2.694 ± 0.015 | 9.566 ± 0.03 |
2.267 ± 0.014 | 3.393 ± 0.018 |
1.84 ± 0.021 | 10.381 ± 0.032 |
Met |
Asn |
Gln |
Pro |
Arg |
Ser |
Thr |
Val |
Trp |
Tyr |
|---|---|---|---|---|---|---|---|---|---|
1.864 ± 0.012 | 1.674 ± 0.015 |
6.387 ± 0.03 | 2.71 ± 0.016 |
8.868 ± 0.031 | 4.581 ± 0.017 |
5.721 ± 0.023 | 8.522 ± 0.029 |
1.536 ± 0.013 | 2.05 ± 0.013 |
Most of the basic statistics you can see at this page can be downloaded from this CSV file
See this proteome in:

Proteome-pI is available under Creative Commons Attribution-NoDerivs license, for more details see here
| Reference: Kozlowski LP. Proteome-pI 2.0: Proteome Isoelectric Point Database Update. Nucleic Acids Res. 2021, doi: 10.1093/nar/gkab944 | Contact: Lukasz P. Kozlowski |