Georgenia muralis
Taxonomy: cellular organisms; Bacteria; Terrabacteria group; Actinobacteria; Actinomycetia; Micrococcales; Bogoriellaceae; Georgenia
Average proteome isoelectric point is 6.18
Get precalculated fractions of proteins
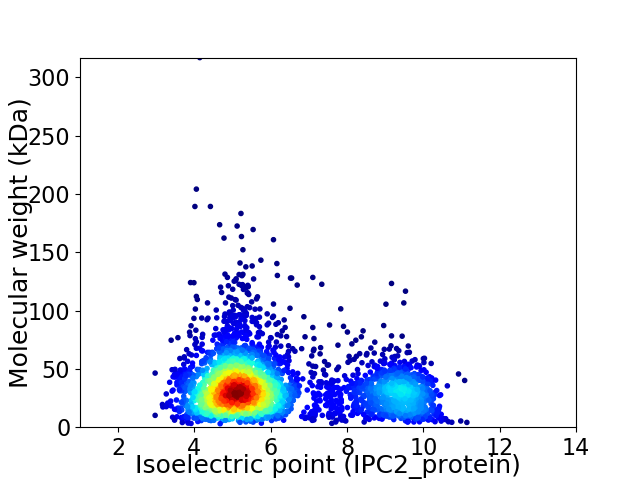
Virtual 2D-PAGE plot for 3556 proteins (isoelectric point calculated using IPC2_protein)
Get csv file with sequences according to given criteria:
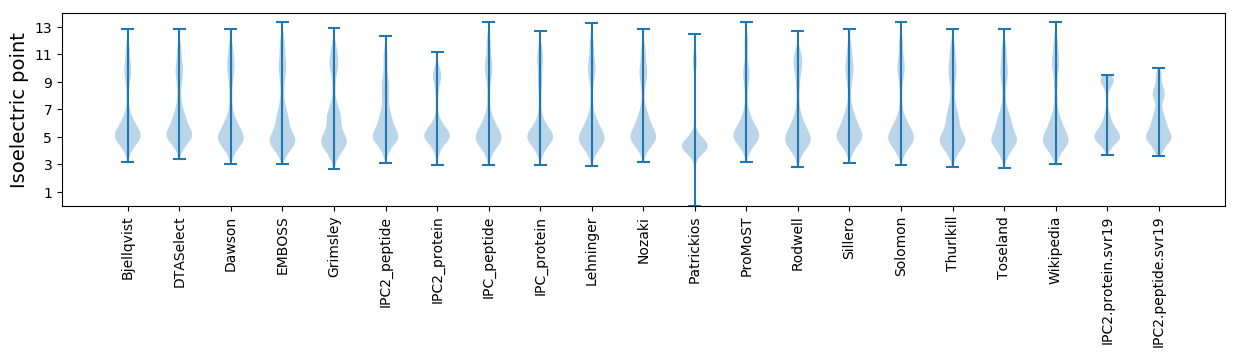
* You can choose from 21 different methods for calculating isoelectric point
Summary statistics related to proteome-wise predictions
Protein with the lowest isoelectric point:
>tr|A0A3N4ZAH6|A0A3N4ZAH6_9MICO Uncharacterized protein (TIGR02679 family) OS=Georgenia muralis OX=154117 GN=EDD32_3631 PE=4 SV=1
MM1 pKa = 7.21STRR4 pKa = 11.84KK5 pKa = 8.45LTAITAATAGALLLASCGGDD25 pKa = 3.06TGGGTGDD32 pKa = 3.21ATGGAEE38 pKa = 4.63GGDD41 pKa = 3.83DD42 pKa = 4.67PIVIGISLPLTGDD55 pKa = 3.18FAEE58 pKa = 5.01PGKK61 pKa = 10.58GVQRR65 pKa = 11.84GYY67 pKa = 8.12EE68 pKa = 3.83TWAKK72 pKa = 10.18VINDD76 pKa = 3.56GGGLLGRR83 pKa = 11.84QVEE86 pKa = 4.42LKK88 pKa = 10.5ILDD91 pKa = 4.39DD92 pKa = 4.56ASDD95 pKa = 3.68AARR98 pKa = 11.84VVADD102 pKa = 3.96YY103 pKa = 10.76EE104 pKa = 4.39SLIAQDD110 pKa = 4.03EE111 pKa = 4.63VDD113 pKa = 4.27LVMGPFSTRR122 pKa = 11.84LVVPASRR129 pKa = 11.84VADD132 pKa = 4.16EE133 pKa = 4.21YY134 pKa = 11.81GMLFVEE140 pKa = 5.08PAAAAAEE147 pKa = 4.17VFEE150 pKa = 5.11NGFEE154 pKa = 4.47NIFYY158 pKa = 9.58AAPAIAPDD166 pKa = 3.66HH167 pKa = 6.18YY168 pKa = 11.49NYY170 pKa = 11.06LLDD173 pKa = 5.22FIEE176 pKa = 5.75AMPEE180 pKa = 3.73DD181 pKa = 4.95EE182 pKa = 4.98RR183 pKa = 11.84PQTAAVAAMDD193 pKa = 4.7DD194 pKa = 4.01PFAQGTAYY202 pKa = 10.51GLRR205 pKa = 11.84DD206 pKa = 3.55GLAEE210 pKa = 4.37LGVEE214 pKa = 3.91IVVDD218 pKa = 3.95EE219 pKa = 4.8VYY221 pKa = 10.62PPNATDD227 pKa = 3.47MSAVAAQIADD237 pKa = 3.77ADD239 pKa = 4.14PDD241 pKa = 4.05VVIGGTQYY249 pKa = 11.2QDD251 pKa = 3.33AVNMILALQQLDD263 pKa = 3.88YY264 pKa = 9.97QPRR267 pKa = 11.84MAAFSTAPTNPEE279 pKa = 3.43FVEE282 pKa = 4.94AIGGAVDD289 pKa = 5.97GILSPTGYY297 pKa = 8.26TVEE300 pKa = 4.0ATFPSNEE307 pKa = 3.83EE308 pKa = 3.36FVAANEE314 pKa = 4.16EE315 pKa = 4.14LHH317 pKa = 6.19GAEE320 pKa = 4.54PGEE323 pKa = 4.65DD324 pKa = 3.12EE325 pKa = 4.84ANAYY329 pKa = 7.45TAGQVVAAAVEE340 pKa = 4.14AVGCAEE346 pKa = 5.59QGDD349 pKa = 4.4CQQDD353 pKa = 4.05LIDD356 pKa = 3.92WLHH359 pKa = 6.04EE360 pKa = 4.23NEE362 pKa = 3.88VDD364 pKa = 3.94TVVGTLGWDD373 pKa = 3.23EE374 pKa = 4.22AGRR377 pKa = 11.84PNGAHH382 pKa = 8.12LIQQYY387 pKa = 10.57VDD389 pKa = 3.48GEE391 pKa = 4.2IAIVLPADD399 pKa = 3.35VAEE402 pKa = 5.07AEE404 pKa = 4.56LIYY407 pKa = 9.76PKK409 pKa = 10.57PEE411 pKa = 3.45WW412 pKa = 3.77
MM1 pKa = 7.21STRR4 pKa = 11.84KK5 pKa = 8.45LTAITAATAGALLLASCGGDD25 pKa = 3.06TGGGTGDD32 pKa = 3.21ATGGAEE38 pKa = 4.63GGDD41 pKa = 3.83DD42 pKa = 4.67PIVIGISLPLTGDD55 pKa = 3.18FAEE58 pKa = 5.01PGKK61 pKa = 10.58GVQRR65 pKa = 11.84GYY67 pKa = 8.12EE68 pKa = 3.83TWAKK72 pKa = 10.18VINDD76 pKa = 3.56GGGLLGRR83 pKa = 11.84QVEE86 pKa = 4.42LKK88 pKa = 10.5ILDD91 pKa = 4.39DD92 pKa = 4.56ASDD95 pKa = 3.68AARR98 pKa = 11.84VVADD102 pKa = 3.96YY103 pKa = 10.76EE104 pKa = 4.39SLIAQDD110 pKa = 4.03EE111 pKa = 4.63VDD113 pKa = 4.27LVMGPFSTRR122 pKa = 11.84LVVPASRR129 pKa = 11.84VADD132 pKa = 4.16EE133 pKa = 4.21YY134 pKa = 11.81GMLFVEE140 pKa = 5.08PAAAAAEE147 pKa = 4.17VFEE150 pKa = 5.11NGFEE154 pKa = 4.47NIFYY158 pKa = 9.58AAPAIAPDD166 pKa = 3.66HH167 pKa = 6.18YY168 pKa = 11.49NYY170 pKa = 11.06LLDD173 pKa = 5.22FIEE176 pKa = 5.75AMPEE180 pKa = 3.73DD181 pKa = 4.95EE182 pKa = 4.98RR183 pKa = 11.84PQTAAVAAMDD193 pKa = 4.7DD194 pKa = 4.01PFAQGTAYY202 pKa = 10.51GLRR205 pKa = 11.84DD206 pKa = 3.55GLAEE210 pKa = 4.37LGVEE214 pKa = 3.91IVVDD218 pKa = 3.95EE219 pKa = 4.8VYY221 pKa = 10.62PPNATDD227 pKa = 3.47MSAVAAQIADD237 pKa = 3.77ADD239 pKa = 4.14PDD241 pKa = 4.05VVIGGTQYY249 pKa = 11.2QDD251 pKa = 3.33AVNMILALQQLDD263 pKa = 3.88YY264 pKa = 9.97QPRR267 pKa = 11.84MAAFSTAPTNPEE279 pKa = 3.43FVEE282 pKa = 4.94AIGGAVDD289 pKa = 5.97GILSPTGYY297 pKa = 8.26TVEE300 pKa = 4.0ATFPSNEE307 pKa = 3.83EE308 pKa = 3.36FVAANEE314 pKa = 4.16EE315 pKa = 4.14LHH317 pKa = 6.19GAEE320 pKa = 4.54PGEE323 pKa = 4.65DD324 pKa = 3.12EE325 pKa = 4.84ANAYY329 pKa = 7.45TAGQVVAAAVEE340 pKa = 4.14AVGCAEE346 pKa = 5.59QGDD349 pKa = 4.4CQQDD353 pKa = 4.05LIDD356 pKa = 3.92WLHH359 pKa = 6.04EE360 pKa = 4.23NEE362 pKa = 3.88VDD364 pKa = 3.94TVVGTLGWDD373 pKa = 3.23EE374 pKa = 4.22AGRR377 pKa = 11.84PNGAHH382 pKa = 8.12LIQQYY387 pKa = 10.57VDD389 pKa = 3.48GEE391 pKa = 4.2IAIVLPADD399 pKa = 3.35VAEE402 pKa = 5.07AEE404 pKa = 4.56LIYY407 pKa = 9.76PKK409 pKa = 10.57PEE411 pKa = 3.45WW412 pKa = 3.77
Molecular weight: 43.07 kDa
Isoelectric point according different methods:
Protein with the highest isoelectric point:
>tr|A0A3N4Z8D2|A0A3N4Z8D2_9MICO Phosphoribosyl-AMP cyclohydrolase OS=Georgenia muralis OX=154117 GN=hisI PE=3 SV=1
MM1 pKa = 7.4GSVIKK6 pKa = 10.38KK7 pKa = 8.42RR8 pKa = 11.84RR9 pKa = 11.84KK10 pKa = 9.06RR11 pKa = 11.84MSKK14 pKa = 9.76KK15 pKa = 9.54KK16 pKa = 9.79HH17 pKa = 5.67RR18 pKa = 11.84KK19 pKa = 8.31LLRR22 pKa = 11.84KK23 pKa = 7.78TRR25 pKa = 11.84HH26 pKa = 3.65QRR28 pKa = 11.84RR29 pKa = 11.84NKK31 pKa = 9.78KK32 pKa = 9.85
MM1 pKa = 7.4GSVIKK6 pKa = 10.38KK7 pKa = 8.42RR8 pKa = 11.84RR9 pKa = 11.84KK10 pKa = 9.06RR11 pKa = 11.84MSKK14 pKa = 9.76KK15 pKa = 9.54KK16 pKa = 9.79HH17 pKa = 5.67RR18 pKa = 11.84KK19 pKa = 8.31LLRR22 pKa = 11.84KK23 pKa = 7.78TRR25 pKa = 11.84HH26 pKa = 3.65QRR28 pKa = 11.84RR29 pKa = 11.84NKK31 pKa = 9.78KK32 pKa = 9.85
Molecular weight: 4.1 kDa
Isoelectric point according different methods:
Peptides (in silico digests for buttom-up proteomics)
Below you can find in silico digests of the whole proteome with Trypsin, Chymotrypsin, Trypsin+LysC, LysN, ArgC proteases suitable for different mass spec machines.| Try ESI |
 |
|---|
| ChTry ESI |
|
|---|
| ArgC ESI |
|
|---|
| LysN ESI |
|
|---|
| TryLysC ESI |
|
|---|
| Try MALDI |
|
|---|
| ChTry MALDI |
|
|---|
| ArgC MALDI |
|
|---|
| LysN MALDI |
|
|---|
| TryLysC MALDI |
|
|---|
| Try LTQ |
|
|---|
| ChTry LTQ |
|
|---|
| ArgC LTQ |
|
|---|
| LysN LTQ |
|
|---|
| TryLysC LTQ |
|
|---|
| Try MSlow |
|
|---|
| ChTry MSlow |
|
|---|
| ArgC MSlow |
|
|---|
| LysN MSlow |
|
|---|
| TryLysC MSlow |
|
|---|
| Try MShigh |
|
|---|
| ChTry MShigh |
|
|---|
| ArgC MShigh |
|
|---|
| LysN MShigh |
|
|---|
| TryLysC MShigh |
|
|---|
General Statistics
Number of major isoforms |
Number of additional isoforms |
Number of all proteins |
Number of amino acids |
Min. Seq. Length |
Max. Seq. Length |
Avg. Seq. Length |
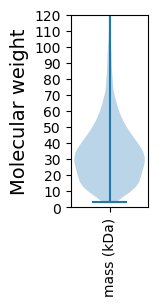
Avg. Mol. Weight |
|---|---|---|---|---|---|---|---|
0 |
1205855 |
30 |
3017 |
339.1 |
36.0 |
Amino acid frequency
Ala |
Cys |
Asp |
Glu |
Phe |
Gly |
His |
Ile |
Lys |
Leu |
|---|---|---|---|---|---|---|---|---|---|
14.424 ± 0.064 | 0.528 ± 0.011 |
6.222 ± 0.034 | 5.813 ± 0.038 |
2.495 ± 0.023 | 9.582 ± 0.044 |
2.192 ± 0.021 | 2.97 ± 0.03 |
1.413 ± 0.022 | 10.403 ± 0.051 |
Met |
Asn |
Gln |
Pro |
Arg |
Ser |
Thr |
Val |
Trp |
Tyr |
|---|---|---|---|---|---|---|---|---|---|
1.739 ± 0.018 | 1.531 ± 0.023 |
5.955 ± 0.03 | 2.463 ± 0.022 |
8.086 ± 0.046 | 4.732 ± 0.024 |
6.302 ± 0.036 | 9.874 ± 0.039 |
1.451 ± 0.017 | 1.824 ± 0.019 |
Most of the basic statistics you can see at this page can be downloaded from this CSV file
See this proteome in:

Proteome-pI is available under Creative Commons Attribution-NoDerivs license, for more details see here
| Reference: Kozlowski LP. Proteome-pI 2.0: Proteome Isoelectric Point Database Update. Nucleic Acids Res. 2021, doi: 10.1093/nar/gkab944 | Contact: Lukasz P. Kozlowski |