Aureobasidium namibiae CBS 147.97
Taxonomy: cellular organisms; Eukaryota; Opisthokonta; Fungi; Dikarya; Ascomycota; saccharomyceta; Pezizomycotina; leotiomyceta; dothideomyceta; Dothideomycetes; Dothideomycetidae; Dothideales; Saccotheciaceae; Aureobasidium; Aureobasidium namibiae
Average proteome isoelectric point is 6.44
Get precalculated fractions of proteins
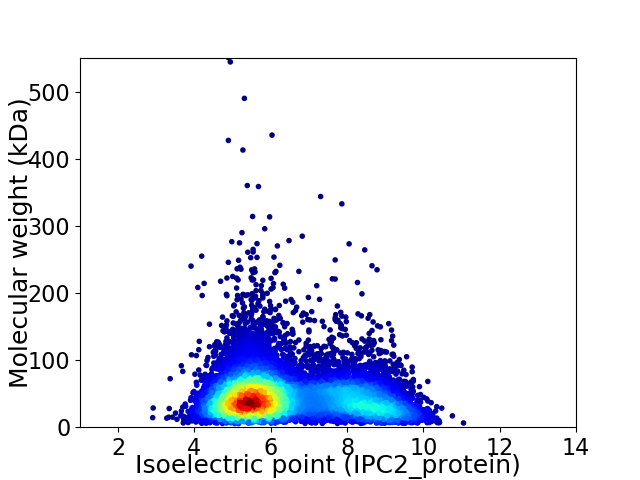
Virtual 2D-PAGE plot for 10258 proteins (isoelectric point calculated using IPC2_protein)
Get csv file with sequences according to given criteria:
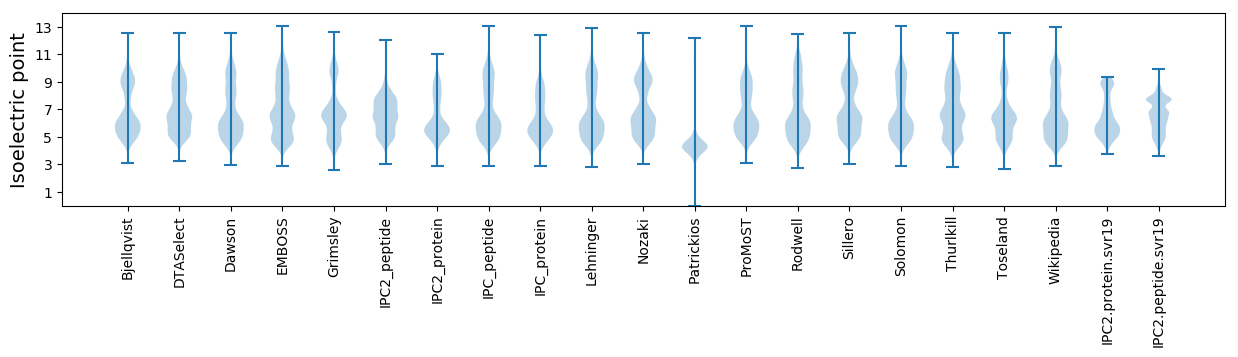
* You can choose from 21 different methods for calculating isoelectric point
Summary statistics related to proteome-wise predictions
Protein with the lowest isoelectric point:
>tr|A0A074XGN1|A0A074XGN1_9PEZI TPT domain-containing protein OS=Aureobasidium namibiae CBS 147.97 OX=1043004 GN=M436DRAFT_45443 PE=4 SV=1
MM1 pKa = 6.6TTPDD5 pKa = 3.4GSPWVAVSKK14 pKa = 9.89TPTTINLHH22 pKa = 6.58ANTSAPSNTTSSDD35 pKa = 3.26QSIATNDD42 pKa = 3.1RR43 pKa = 11.84HH44 pKa = 7.59LSDD47 pKa = 3.98LRR49 pKa = 11.84SWLYY53 pKa = 10.33ATFSWGYY60 pKa = 6.08EE61 pKa = 4.01TPAASSAVAAPSTQATYY78 pKa = 10.79AAASSAAHH86 pKa = 6.12SSATGEE92 pKa = 4.28VLATPADD99 pKa = 3.56NGAEE103 pKa = 4.02YY104 pKa = 10.47LSPVTIGGQKK114 pKa = 10.33LDD116 pKa = 4.25LNFDD120 pKa = 3.93TGSSDD125 pKa = 3.07LWVFSTALTSAQIGEE140 pKa = 4.23HH141 pKa = 5.66SAYY144 pKa = 10.4DD145 pKa = 3.72PSKK148 pKa = 10.61SSSYY152 pKa = 9.97QQLDD156 pKa = 3.03GSTFSLSYY164 pKa = 11.28GDD166 pKa = 3.92GSGAAGVVGFDD177 pKa = 3.34TVDD180 pKa = 2.66IGGATVTRR188 pKa = 11.84QAIEE192 pKa = 4.0LATSVSSAFVSDD204 pKa = 3.92ADD206 pKa = 3.7SDD208 pKa = 4.37GLVGLAFSTLNSVSPRR224 pKa = 11.84PQKK227 pKa = 9.92TFFDD231 pKa = 4.42NIMSEE236 pKa = 4.26LAQPVFTAALDD247 pKa = 3.91LDD249 pKa = 4.16GSGTYY254 pKa = 10.34EE255 pKa = 4.23FGTIDD260 pKa = 3.2SSKK263 pKa = 9.87FTGDD267 pKa = 3.49LQFTPVNASSGFWQVDD283 pKa = 3.55SNRR286 pKa = 11.84YY287 pKa = 9.48SIGGKK292 pKa = 9.92DD293 pKa = 3.85CDD295 pKa = 3.7RR296 pKa = 11.84TNASPAIIDD305 pKa = 3.66TGTSLLLLDD314 pKa = 4.51PEE316 pKa = 4.84VVQAYY321 pKa = 9.74YY322 pKa = 11.4ADD324 pKa = 4.19IPSASYY330 pKa = 10.89DD331 pKa = 3.75STVGGYY337 pKa = 8.5TYY339 pKa = 10.81DD340 pKa = 3.57CSEE343 pKa = 4.62SLPEE347 pKa = 3.74FAVAVGDD354 pKa = 3.74YY355 pKa = 7.91MANIPGSGITFAPVSTKK372 pKa = 9.49TCFGGVQSNSGSDD385 pKa = 3.37LQIFGDD391 pKa = 4.09VLLKK395 pKa = 10.57HH396 pKa = 6.31HH397 pKa = 6.44FVVFNGQSEE406 pKa = 5.07VIGMAAKK413 pKa = 10.67AEE415 pKa = 4.12
MM1 pKa = 6.6TTPDD5 pKa = 3.4GSPWVAVSKK14 pKa = 9.89TPTTINLHH22 pKa = 6.58ANTSAPSNTTSSDD35 pKa = 3.26QSIATNDD42 pKa = 3.1RR43 pKa = 11.84HH44 pKa = 7.59LSDD47 pKa = 3.98LRR49 pKa = 11.84SWLYY53 pKa = 10.33ATFSWGYY60 pKa = 6.08EE61 pKa = 4.01TPAASSAVAAPSTQATYY78 pKa = 10.79AAASSAAHH86 pKa = 6.12SSATGEE92 pKa = 4.28VLATPADD99 pKa = 3.56NGAEE103 pKa = 4.02YY104 pKa = 10.47LSPVTIGGQKK114 pKa = 10.33LDD116 pKa = 4.25LNFDD120 pKa = 3.93TGSSDD125 pKa = 3.07LWVFSTALTSAQIGEE140 pKa = 4.23HH141 pKa = 5.66SAYY144 pKa = 10.4DD145 pKa = 3.72PSKK148 pKa = 10.61SSSYY152 pKa = 9.97QQLDD156 pKa = 3.03GSTFSLSYY164 pKa = 11.28GDD166 pKa = 3.92GSGAAGVVGFDD177 pKa = 3.34TVDD180 pKa = 2.66IGGATVTRR188 pKa = 11.84QAIEE192 pKa = 4.0LATSVSSAFVSDD204 pKa = 3.92ADD206 pKa = 3.7SDD208 pKa = 4.37GLVGLAFSTLNSVSPRR224 pKa = 11.84PQKK227 pKa = 9.92TFFDD231 pKa = 4.42NIMSEE236 pKa = 4.26LAQPVFTAALDD247 pKa = 3.91LDD249 pKa = 4.16GSGTYY254 pKa = 10.34EE255 pKa = 4.23FGTIDD260 pKa = 3.2SSKK263 pKa = 9.87FTGDD267 pKa = 3.49LQFTPVNASSGFWQVDD283 pKa = 3.55SNRR286 pKa = 11.84YY287 pKa = 9.48SIGGKK292 pKa = 9.92DD293 pKa = 3.85CDD295 pKa = 3.7RR296 pKa = 11.84TNASPAIIDD305 pKa = 3.66TGTSLLLLDD314 pKa = 4.51PEE316 pKa = 4.84VVQAYY321 pKa = 9.74YY322 pKa = 11.4ADD324 pKa = 4.19IPSASYY330 pKa = 10.89DD331 pKa = 3.75STVGGYY337 pKa = 8.5TYY339 pKa = 10.81DD340 pKa = 3.57CSEE343 pKa = 4.62SLPEE347 pKa = 3.74FAVAVGDD354 pKa = 3.74YY355 pKa = 7.91MANIPGSGITFAPVSTKK372 pKa = 9.49TCFGGVQSNSGSDD385 pKa = 3.37LQIFGDD391 pKa = 4.09VLLKK395 pKa = 10.57HH396 pKa = 6.31HH397 pKa = 6.44FVVFNGQSEE406 pKa = 5.07VIGMAAKK413 pKa = 10.67AEE415 pKa = 4.12
Molecular weight: 43.06 kDa
Isoelectric point according different methods:
Protein with the highest isoelectric point:
>tr|A0A074X0M6|A0A074X0M6_9PEZI Uncharacterized protein OS=Aureobasidium namibiae CBS 147.97 OX=1043004 GN=M436DRAFT_36588 PE=3 SV=1
MM1 pKa = 7.88PSHH4 pKa = 6.91KK5 pKa = 10.39SFRR8 pKa = 11.84TKK10 pKa = 10.45QKK12 pKa = 9.84LAKK15 pKa = 9.55AQKK18 pKa = 8.59QNRR21 pKa = 11.84PIPQWIRR28 pKa = 11.84LRR30 pKa = 11.84TNNTIRR36 pKa = 11.84YY37 pKa = 5.73NAKK40 pKa = 8.89RR41 pKa = 11.84RR42 pKa = 11.84HH43 pKa = 4.15WRR45 pKa = 11.84KK46 pKa = 7.38TRR48 pKa = 11.84IGII51 pKa = 4.0
MM1 pKa = 7.88PSHH4 pKa = 6.91KK5 pKa = 10.39SFRR8 pKa = 11.84TKK10 pKa = 10.45QKK12 pKa = 9.84LAKK15 pKa = 9.55AQKK18 pKa = 8.59QNRR21 pKa = 11.84PIPQWIRR28 pKa = 11.84LRR30 pKa = 11.84TNNTIRR36 pKa = 11.84YY37 pKa = 5.73NAKK40 pKa = 8.89RR41 pKa = 11.84RR42 pKa = 11.84HH43 pKa = 4.15WRR45 pKa = 11.84KK46 pKa = 7.38TRR48 pKa = 11.84IGII51 pKa = 4.0
Molecular weight: 6.31 kDa
Isoelectric point according different methods:
Peptides (in silico digests for buttom-up proteomics)
Below you can find in silico digests of the whole proteome with Trypsin, Chymotrypsin, Trypsin+LysC, LysN, ArgC proteases suitable for different mass spec machines.| Try ESI |
 |
|---|
| ChTry ESI |
|
|---|
| ArgC ESI |
|
|---|
| LysN ESI |
|
|---|
| TryLysC ESI |
|
|---|
| Try MALDI |
|
|---|
| ChTry MALDI |
|
|---|
| ArgC MALDI |
|
|---|
| LysN MALDI |
|
|---|
| TryLysC MALDI |
|
|---|
| Try LTQ |
|
|---|
| ChTry LTQ |
|
|---|
| ArgC LTQ |
|
|---|
| LysN LTQ |
|
|---|
| TryLysC LTQ |
|
|---|
| Try MSlow |
|
|---|
| ChTry MSlow |
|
|---|
| ArgC MSlow |
|
|---|
| LysN MSlow |
|
|---|
| TryLysC MSlow |
|
|---|
| Try MShigh |
|
|---|
| ChTry MShigh |
|
|---|
| ArgC MShigh |
|
|---|
| LysN MShigh |
|
|---|
| TryLysC MShigh |
|
|---|
General Statistics
Number of major isoforms |
Number of additional isoforms |
Number of all proteins |
Number of amino acids |
Min. Seq. Length |
Max. Seq. Length |
Avg. Seq. Length |
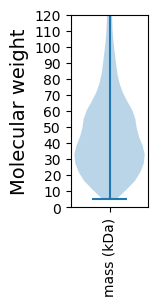
Avg. Mol. Weight |
|---|---|---|---|---|---|---|---|
0 |
4634218 |
49 |
4952 |
451.8 |
49.99 |
Amino acid frequency
Ala |
Cys |
Asp |
Glu |
Phe |
Gly |
His |
Ile |
Lys |
Leu |
|---|---|---|---|---|---|---|---|---|---|
8.927 ± 0.019 | 1.243 ± 0.01 |
5.824 ± 0.015 | 5.972 ± 0.022 |
3.728 ± 0.015 | 6.556 ± 0.023 |
2.427 ± 0.01 | 4.893 ± 0.014 |
4.998 ± 0.024 | 8.811 ± 0.027 |
Met |
Asn |
Gln |
Pro |
Arg |
Ser |
Thr |
Val |
Trp |
Tyr |
|---|---|---|---|---|---|---|---|---|---|
2.24 ± 0.011 | 3.828 ± 0.012 |
5.756 ± 0.025 | 4.191 ± 0.019 |
5.773 ± 0.021 | 8.275 ± 0.038 |
6.153 ± 0.021 | 6.13 ± 0.017 |
1.448 ± 0.01 | 2.825 ± 0.014 |
Most of the basic statistics you can see at this page can be downloaded from this CSV file
See this proteome in:

Proteome-pI is available under Creative Commons Attribution-NoDerivs license, for more details see here
| Reference: Kozlowski LP. Proteome-pI 2.0: Proteome Isoelectric Point Database Update. Nucleic Acids Res. 2021, doi: 10.1093/nar/gkab944 | Contact: Lukasz P. Kozlowski |