Antrodiella citrinella
Taxonomy: cellular organisms; Eukaryota; Opisthokonta; Fungi; Dikarya; Basidiomycota; Agaricomycotina; Agaricomycetes; Agaricomycetes incertae sedis; Polyporales; Steccherinaceae; Antrodiella
Average proteome isoelectric point is 6.23
Get precalculated fractions of proteins
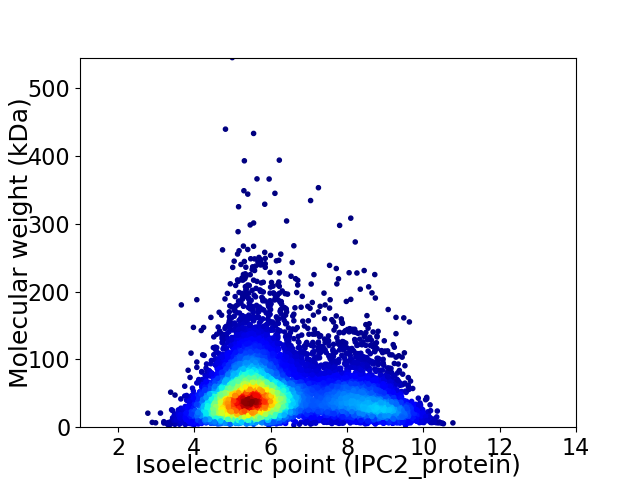
Virtual 2D-PAGE plot for 9798 proteins (isoelectric point calculated using IPC2_protein)
Get csv file with sequences according to given criteria:
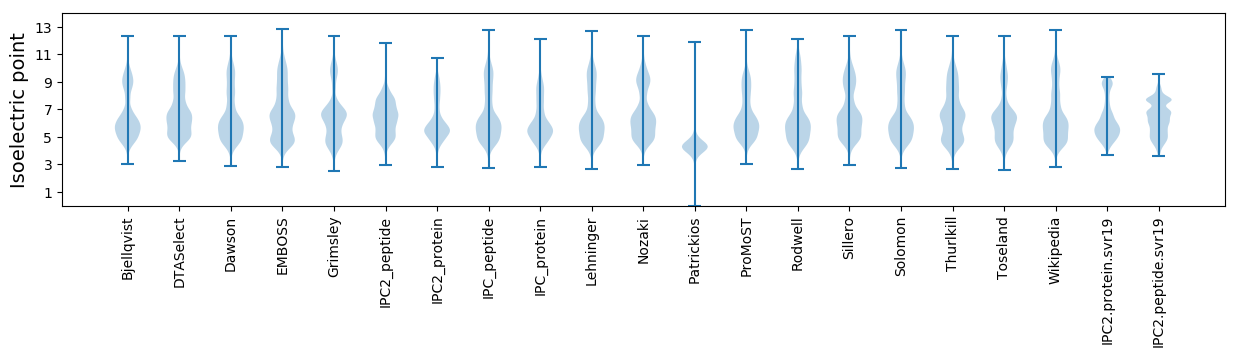
* You can choose from 21 different methods for calculating isoelectric point
Summary statistics related to proteome-wise predictions
Protein with the lowest isoelectric point:
>tr|A0A4S4MPP3|A0A4S4MPP3_9APHY HIG1 domain-containing protein OS=Antrodiella citrinella OX=2447956 GN=EUX98_g6970 PE=4 SV=1
MM1 pKa = 7.21PTASTDD7 pKa = 3.82FTLEE11 pKa = 4.06LPAMDD16 pKa = 5.15SDD18 pKa = 6.14LMPEE22 pKa = 3.96WLYY25 pKa = 11.24EE26 pKa = 4.19PGPEE30 pKa = 4.86IPLTQDD36 pKa = 3.0DD37 pKa = 3.83VRR39 pKa = 11.84RR40 pKa = 11.84LYY42 pKa = 11.02RR43 pKa = 11.84NSTCTTTEE51 pKa = 3.96DD52 pKa = 4.2SLSLGYY58 pKa = 10.79GSIRR62 pKa = 11.84APSPAEE68 pKa = 3.95LQSLWDD74 pKa = 4.28DD75 pKa = 4.07SEE77 pKa = 5.05SDD79 pKa = 3.57SGSDD83 pKa = 4.96DD84 pKa = 4.0EE85 pKa = 5.8PFDD88 pKa = 6.36DD89 pKa = 5.99EE90 pKa = 7.33DD91 pKa = 5.94DD92 pKa = 4.75DD93 pKa = 5.71EE94 pKa = 4.62NLCVSDD100 pKa = 5.23ADD102 pKa = 4.02TDD104 pKa = 4.06STSATLHH111 pKa = 6.54DD112 pKa = 5.01APVDD116 pKa = 4.02PADD119 pKa = 4.27HH120 pKa = 6.7APSTSALKK128 pKa = 10.22QPQLISPPSPPSPRR142 pKa = 11.84RR143 pKa = 11.84HH144 pKa = 6.36PDD146 pKa = 3.14DD147 pKa = 4.29LLRR150 pKa = 11.84LYY152 pKa = 10.04AYY154 pKa = 10.7SSADD158 pKa = 3.48PDD160 pKa = 4.66LATCLHH166 pKa = 6.9GIDD169 pKa = 4.78EE170 pKa = 5.14ALLCNPFSVYY180 pKa = 11.26ADD182 pKa = 3.36VCYY185 pKa = 10.48NAAVKK190 pKa = 10.47RR191 pKa = 11.84EE192 pKa = 4.01PQNGGVSRR200 pKa = 11.84GSNEE204 pKa = 3.79LEE206 pKa = 3.7RR207 pKa = 11.84VTEE210 pKa = 3.87EE211 pKa = 5.06DD212 pKa = 3.21EE213 pKa = 4.39TEE215 pKa = 3.96EE216 pKa = 4.45AEE218 pKa = 4.37SEE220 pKa = 4.14EE221 pKa = 5.28SEE223 pKa = 5.71DD224 pKa = 3.29EE225 pKa = 4.33DD226 pKa = 4.75EE227 pKa = 5.03PVLHH231 pKa = 6.97SPIQTGVVASNWTSGVYY248 pKa = 9.82VGNAPSEE255 pKa = 4.18ALSALALPAPYY266 pKa = 9.64HH267 pKa = 5.81ATMDD271 pKa = 3.88SKK273 pKa = 10.87PGCFVSPVSTNN284 pKa = 2.84
MM1 pKa = 7.21PTASTDD7 pKa = 3.82FTLEE11 pKa = 4.06LPAMDD16 pKa = 5.15SDD18 pKa = 6.14LMPEE22 pKa = 3.96WLYY25 pKa = 11.24EE26 pKa = 4.19PGPEE30 pKa = 4.86IPLTQDD36 pKa = 3.0DD37 pKa = 3.83VRR39 pKa = 11.84RR40 pKa = 11.84LYY42 pKa = 11.02RR43 pKa = 11.84NSTCTTTEE51 pKa = 3.96DD52 pKa = 4.2SLSLGYY58 pKa = 10.79GSIRR62 pKa = 11.84APSPAEE68 pKa = 3.95LQSLWDD74 pKa = 4.28DD75 pKa = 4.07SEE77 pKa = 5.05SDD79 pKa = 3.57SGSDD83 pKa = 4.96DD84 pKa = 4.0EE85 pKa = 5.8PFDD88 pKa = 6.36DD89 pKa = 5.99EE90 pKa = 7.33DD91 pKa = 5.94DD92 pKa = 4.75DD93 pKa = 5.71EE94 pKa = 4.62NLCVSDD100 pKa = 5.23ADD102 pKa = 4.02TDD104 pKa = 4.06STSATLHH111 pKa = 6.54DD112 pKa = 5.01APVDD116 pKa = 4.02PADD119 pKa = 4.27HH120 pKa = 6.7APSTSALKK128 pKa = 10.22QPQLISPPSPPSPRR142 pKa = 11.84RR143 pKa = 11.84HH144 pKa = 6.36PDD146 pKa = 3.14DD147 pKa = 4.29LLRR150 pKa = 11.84LYY152 pKa = 10.04AYY154 pKa = 10.7SSADD158 pKa = 3.48PDD160 pKa = 4.66LATCLHH166 pKa = 6.9GIDD169 pKa = 4.78EE170 pKa = 5.14ALLCNPFSVYY180 pKa = 11.26ADD182 pKa = 3.36VCYY185 pKa = 10.48NAAVKK190 pKa = 10.47RR191 pKa = 11.84EE192 pKa = 4.01PQNGGVSRR200 pKa = 11.84GSNEE204 pKa = 3.79LEE206 pKa = 3.7RR207 pKa = 11.84VTEE210 pKa = 3.87EE211 pKa = 5.06DD212 pKa = 3.21EE213 pKa = 4.39TEE215 pKa = 3.96EE216 pKa = 4.45AEE218 pKa = 4.37SEE220 pKa = 4.14EE221 pKa = 5.28SEE223 pKa = 5.71DD224 pKa = 3.29EE225 pKa = 4.33DD226 pKa = 4.75EE227 pKa = 5.03PVLHH231 pKa = 6.97SPIQTGVVASNWTSGVYY248 pKa = 9.82VGNAPSEE255 pKa = 4.18ALSALALPAPYY266 pKa = 9.64HH267 pKa = 5.81ATMDD271 pKa = 3.88SKK273 pKa = 10.87PGCFVSPVSTNN284 pKa = 2.84
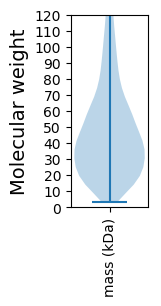
Molecular weight: 30.62 kDa
Isoelectric point according different methods:
Protein with the highest isoelectric point:
>tr|A0A4S4MVL2|A0A4S4MVL2_9APHY Signal recognition particle receptor subunit beta OS=Antrodiella citrinella OX=2447956 GN=EUX98_g3829 PE=3 SV=1
MM1 pKa = 6.8THH3 pKa = 6.6DD4 pKa = 5.65AIWFSRR10 pKa = 11.84PRR12 pKa = 11.84KK13 pKa = 7.98YY14 pKa = 11.02GKK16 pKa = 10.34GSRR19 pKa = 11.84QCRR22 pKa = 11.84LCAHH26 pKa = 5.84QAGLIRR32 pKa = 11.84KK33 pKa = 9.09YY34 pKa = 10.91GIDD37 pKa = 3.51LCRR40 pKa = 11.84QCFRR44 pKa = 11.84EE45 pKa = 4.02KK46 pKa = 10.43SAAIGFTKK54 pKa = 10.0TRR56 pKa = 3.53
MM1 pKa = 6.8THH3 pKa = 6.6DD4 pKa = 5.65AIWFSRR10 pKa = 11.84PRR12 pKa = 11.84KK13 pKa = 7.98YY14 pKa = 11.02GKK16 pKa = 10.34GSRR19 pKa = 11.84QCRR22 pKa = 11.84LCAHH26 pKa = 5.84QAGLIRR32 pKa = 11.84KK33 pKa = 9.09YY34 pKa = 10.91GIDD37 pKa = 3.51LCRR40 pKa = 11.84QCFRR44 pKa = 11.84EE45 pKa = 4.02KK46 pKa = 10.43SAAIGFTKK54 pKa = 10.0TRR56 pKa = 3.53
Molecular weight: 6.52 kDa
Isoelectric point according different methods:
Peptides (in silico digests for buttom-up proteomics)
Below you can find in silico digests of the whole proteome with Trypsin, Chymotrypsin, Trypsin+LysC, LysN, ArgC proteases suitable for different mass spec machines.| Try ESI |
 |
|---|
| ChTry ESI |
|
|---|
| ArgC ESI |
|
|---|
| LysN ESI |
|
|---|
| TryLysC ESI |
|
|---|
| Try MALDI |
|
|---|
| ChTry MALDI |
|
|---|
| ArgC MALDI |
|
|---|
| LysN MALDI |
|
|---|
| TryLysC MALDI |
|
|---|
| Try LTQ |
|
|---|
| ChTry LTQ |
|
|---|
| ArgC LTQ |
|
|---|
| LysN LTQ |
|
|---|
| TryLysC LTQ |
|
|---|
| Try MSlow |
|
|---|
| ChTry MSlow |
|
|---|
| ArgC MSlow |
|
|---|
| LysN MSlow |
|
|---|
| TryLysC MSlow |
|
|---|
| Try MShigh |
|
|---|
| ChTry MShigh |
|
|---|
| ArgC MShigh |
|
|---|
| LysN MShigh |
|
|---|
| TryLysC MShigh |
|
|---|
General Statistics
Number of major isoforms |
Number of additional isoforms |
Number of all proteins |
Number of amino acids |
Min. Seq. Length |
Max. Seq. Length |
Avg. Seq. Length |
Avg. Mol. Weight |
|---|---|---|---|---|---|---|---|
0 |
4715391 |
28 |
4919 |
481.3 |
53.14 |
Amino acid frequency
Ala |
Cys |
Asp |
Glu |
Phe |
Gly |
His |
Ile |
Lys |
Leu |
|---|---|---|---|---|---|---|---|---|---|
8.829 ± 0.02 | 1.08 ± 0.008 |
6.015 ± 0.019 | 6.098 ± 0.024 |
3.703 ± 0.015 | 6.339 ± 0.02 |
2.536 ± 0.011 | 4.761 ± 0.017 |
4.703 ± 0.021 | 9.026 ± 0.027 |
Met |
Asn |
Gln |
Pro |
Arg |
Ser |
Thr |
Val |
Trp |
Tyr |
|---|---|---|---|---|---|---|---|---|---|
2.155 ± 0.008 | 3.378 ± 0.014 |
6.413 ± 0.028 | 3.75 ± 0.016 |
5.972 ± 0.021 | 8.341 ± 0.029 |
6.118 ± 0.015 | 6.671 ± 0.019 |
1.373 ± 0.007 | 2.678 ± 0.011 |
Most of the basic statistics you can see at this page can be downloaded from this CSV file
See this proteome in:

Proteome-pI is available under Creative Commons Attribution-NoDerivs license, for more details see here
| Reference: Kozlowski LP. Proteome-pI 2.0: Proteome Isoelectric Point Database Update. Nucleic Acids Res. 2021, doi: 10.1093/nar/gkab944 | Contact: Lukasz P. Kozlowski |