Streptomyces phage IchabodCrane
Taxonomy: Viruses; Duplodnaviria; Heunggongvirae; Uroviricota; Caudoviricetes; Caudovirales; Siphoviridae; Karimacvirus; unclassified Karimacvirus
Average proteome isoelectric point is 6.47
Get precalculated fractions of proteins
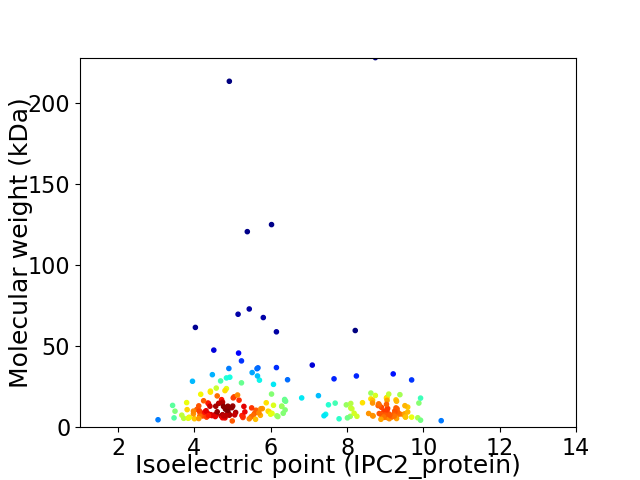
Virtual 2D-PAGE plot for 214 proteins (isoelectric point calculated using IPC2_protein)
Get csv file with sequences according to given criteria:
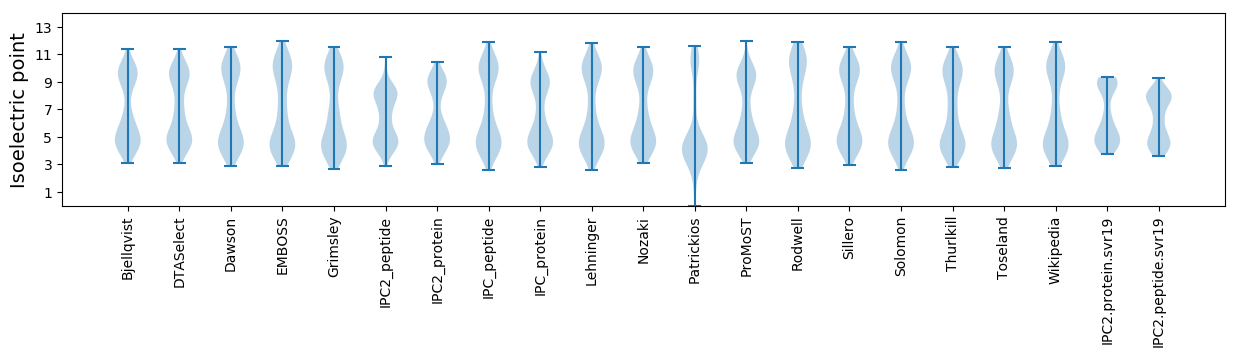
* You can choose from 21 different methods for calculating isoelectric point
Summary statistics related to proteome-wise predictions
Protein with the lowest isoelectric point:
>tr|A0A5P8DEC4|A0A5P8DEC4_9CAUD Uncharacterized protein OS=Streptomyces phage IchabodCrane OX=2652898 GN=26 PE=4 SV=1
MM1 pKa = 7.48NIDD4 pKa = 3.87DD5 pKa = 6.42LIEE8 pKa = 4.1EE9 pKa = 4.25WHH11 pKa = 6.9EE12 pKa = 4.24GDD14 pKa = 4.8SPLPLHH20 pKa = 6.79EE21 pKa = 4.39FLGMTSEE28 pKa = 4.44EE29 pKa = 3.84YY30 pKa = 10.95DD31 pKa = 3.5LFVRR35 pKa = 11.84FGTLPEE41 pKa = 5.11GITYY45 pKa = 10.7GDD47 pKa = 3.54SS48 pKa = 3.12
MM1 pKa = 7.48NIDD4 pKa = 3.87DD5 pKa = 6.42LIEE8 pKa = 4.1EE9 pKa = 4.25WHH11 pKa = 6.9EE12 pKa = 4.24GDD14 pKa = 4.8SPLPLHH20 pKa = 6.79EE21 pKa = 4.39FLGMTSEE28 pKa = 4.44EE29 pKa = 3.84YY30 pKa = 10.95DD31 pKa = 3.5LFVRR35 pKa = 11.84FGTLPEE41 pKa = 5.11GITYY45 pKa = 10.7GDD47 pKa = 3.54SS48 pKa = 3.12
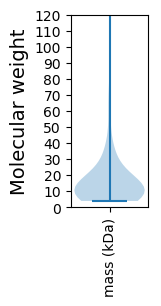
Molecular weight: 5.52 kDa
Isoelectric point according different methods:
Protein with the highest isoelectric point:
>tr|A0A5P8DEJ2|A0A5P8DEJ2_9CAUD HNH endonuclease OS=Streptomyces phage IchabodCrane OX=2652898 GN=98 PE=4 SV=1
MM1 pKa = 7.42ALVGNSNTCWFQRR14 pKa = 11.84CGNKK18 pKa = 9.45PIHH21 pKa = 7.29RR22 pKa = 11.84IRR24 pKa = 11.84YY25 pKa = 6.78YY26 pKa = 10.09NKK28 pKa = 9.42TVMVCNKK35 pKa = 9.76HH36 pKa = 6.39KK37 pKa = 10.88NLDD40 pKa = 3.8GAGCAPSRR48 pKa = 11.84RR49 pKa = 11.84RR50 pKa = 11.84PKK52 pKa = 10.83GSAA55 pKa = 2.9
MM1 pKa = 7.42ALVGNSNTCWFQRR14 pKa = 11.84CGNKK18 pKa = 9.45PIHH21 pKa = 7.29RR22 pKa = 11.84IRR24 pKa = 11.84YY25 pKa = 6.78YY26 pKa = 10.09NKK28 pKa = 9.42TVMVCNKK35 pKa = 9.76HH36 pKa = 6.39KK37 pKa = 10.88NLDD40 pKa = 3.8GAGCAPSRR48 pKa = 11.84RR49 pKa = 11.84RR50 pKa = 11.84PKK52 pKa = 10.83GSAA55 pKa = 2.9
Molecular weight: 6.21 kDa
Isoelectric point according different methods:
Peptides (in silico digests for buttom-up proteomics)
Below you can find in silico digests of the whole proteome with Trypsin, Chymotrypsin, Trypsin+LysC, LysN, ArgC proteases suitable for different mass spec machines.| Try ESI |
 |
|---|
| ChTry ESI |
|
|---|
| ArgC ESI |
|
|---|
| LysN ESI |
|
|---|
| TryLysC ESI |
|
|---|
| Try MALDI |
|
|---|
| ChTry MALDI |
|
|---|
| ArgC MALDI |
|
|---|
| LysN MALDI |
|
|---|
| TryLysC MALDI |
|
|---|
| Try LTQ |
|
|---|
| ChTry LTQ |
|
|---|
| ArgC LTQ |
|
|---|
| LysN LTQ |
|
|---|
| TryLysC LTQ |
|
|---|
| Try MSlow |
|
|---|
| ChTry MSlow |
|
|---|
| ArgC MSlow |
|
|---|
| LysN MSlow |
|
|---|
| TryLysC MSlow |
|
|---|
| Try MShigh |
|
|---|
| ChTry MShigh |
|
|---|
| ArgC MShigh |
|
|---|
| LysN MShigh |
|
|---|
| TryLysC MShigh |
|
|---|
General Statistics
Number of major isoforms |
Number of additional isoforms |
Number of all proteins |
Number of amino acids |
Min. Seq. Length |
Max. Seq. Length |
Avg. Seq. Length |
Avg. Mol. Weight |
|---|---|---|---|---|---|---|---|
0 |
33830 |
34 |
2099 |
158.1 |
17.76 |
Amino acid frequency
Ala |
Cys |
Asp |
Glu |
Phe |
Gly |
His |
Ile |
Lys |
Leu |
|---|---|---|---|---|---|---|---|---|---|
8.46 ± 0.338 | 1.052 ± 0.114 |
6.426 ± 0.178 | 7.026 ± 0.352 |
3.804 ± 0.127 | 7.467 ± 0.232 |
1.75 ± 0.109 | 5.436 ± 0.148 |
6.61 ± 0.329 | 7.21 ± 0.215 |
Met |
Asn |
Gln |
Pro |
Arg |
Ser |
Thr |
Val |
Trp |
Tyr |
|---|---|---|---|---|---|---|---|---|---|
3.042 ± 0.134 | 4.611 ± 0.148 |
3.586 ± 0.157 | 3.263 ± 0.197 |
5.542 ± 0.191 | 5.862 ± 0.259 |
6.113 ± 0.396 | 6.988 ± 0.202 |
1.96 ± 0.09 | 3.792 ± 0.181 |
Most of the basic statistics you can see at this page can be downloaded from this CSV file
See this proteome in:

Proteome-pI is available under Creative Commons Attribution-NoDerivs license, for more details see here
| Reference: Kozlowski LP. Proteome-pI 2.0: Proteome Isoelectric Point Database Update. Nucleic Acids Res. 2021, doi: 10.1093/nar/gkab944 | Contact: Lukasz P. Kozlowski |