Capsaspora owczarzaki (strain ATCC 30864)
Taxonomy: cellular organisms; Eukaryota; Opisthokonta; Filasterea; Capsaspora; Capsaspora owczarzaki
Average proteome isoelectric point is 6.44
Get precalculated fractions of proteins
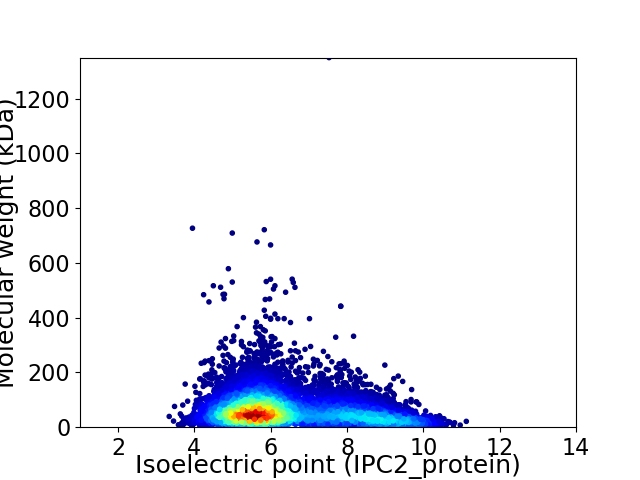
Virtual 2D-PAGE plot for 9794 proteins (isoelectric point calculated using IPC2_protein)
Get csv file with sequences according to given criteria:
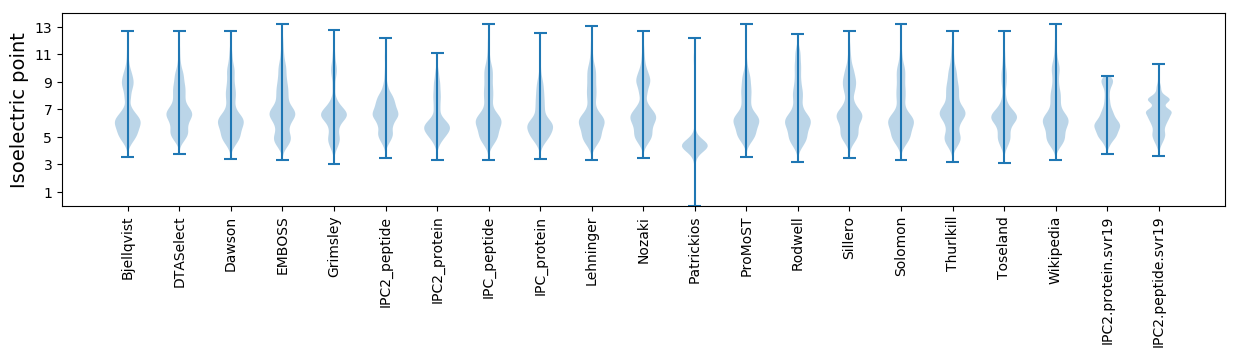
* You can choose from 21 different methods for calculating isoelectric point
Summary statistics related to proteome-wise predictions
Protein with the lowest isoelectric point:
>tr|A0A0D2VYG0|A0A0D2VYG0_CAPO3 DNA-directed DNA polymerase OS=Capsaspora owczarzaki (strain ATCC 30864) OX=595528 GN=CAOG_007029 PE=3 SV=1
MM1 pKa = 7.03RR2 pKa = 11.84TVVPFILVAILVAVSVVDD20 pKa = 3.95SQPQPHH26 pKa = 6.28EE27 pKa = 4.19RR28 pKa = 11.84QRR30 pKa = 11.84LEE32 pKa = 3.62PVAYY36 pKa = 10.31RR37 pKa = 11.84FDD39 pKa = 4.19AEE41 pKa = 4.4HH42 pKa = 7.26DD43 pKa = 3.8GSEE46 pKa = 4.13LLEE49 pKa = 4.54GVDD52 pKa = 4.24IDD54 pKa = 5.6LDD56 pKa = 3.75TDD58 pKa = 3.66EE59 pKa = 5.98VDD61 pKa = 2.93MSRR64 pKa = 11.84FDD66 pKa = 3.83RR67 pKa = 11.84SSSSSSAAFDD77 pKa = 4.35LDD79 pKa = 3.97DD80 pKa = 5.92DD81 pKa = 4.55GEE83 pKa = 4.17EE84 pKa = 3.85MHH86 pKa = 6.67MDD88 pKa = 3.36IYY90 pKa = 11.16YY91 pKa = 10.76DD92 pKa = 3.7EE93 pKa = 5.41ANGVYY98 pKa = 10.23VDD100 pKa = 3.2AHH102 pKa = 6.16GNQLFTPAEE111 pKa = 4.13MEE113 pKa = 3.99ALQAQFDD120 pKa = 3.93NALEE124 pKa = 4.21NEE126 pKa = 4.23EE127 pKa = 4.05AAYY130 pKa = 9.92AYY132 pKa = 7.7HH133 pKa = 5.87TTTFEE138 pKa = 4.01GNAPIPSEE146 pKa = 3.8NVYY149 pKa = 10.69FEE151 pKa = 4.74ILDD154 pKa = 4.05PPEE157 pKa = 3.71IAYY160 pKa = 8.5MYY162 pKa = 9.91TGVISFNIGVDD173 pKa = 3.95FEE175 pKa = 5.13FMLDD179 pKa = 3.38PAYY182 pKa = 10.73LVLSEE187 pKa = 5.49PYY189 pKa = 9.97DD190 pKa = 3.53ACQPLNGEE198 pKa = 4.17QFHH201 pKa = 7.1DD202 pKa = 3.48AVVMVEE208 pKa = 4.69RR209 pKa = 11.84GTCSFIEE216 pKa = 4.07KK217 pKa = 10.0AINVASAGAAAMIVADD233 pKa = 4.5NEE235 pKa = 4.14PPEE238 pKa = 4.9DD239 pKa = 4.41SILVDD244 pKa = 3.54MVSDD248 pKa = 4.31DD249 pKa = 3.95GRR251 pKa = 11.84LASIPCVFIQTQDD264 pKa = 2.99GAKK267 pKa = 9.32IRR269 pKa = 11.84NAIYY273 pKa = 8.88QHH275 pKa = 6.07GVSGVPITIPLNITMQTQEE294 pKa = 4.15AFVDD298 pKa = 4.45SFVPWAPLLL307 pKa = 4.01
MM1 pKa = 7.03RR2 pKa = 11.84TVVPFILVAILVAVSVVDD20 pKa = 3.95SQPQPHH26 pKa = 6.28EE27 pKa = 4.19RR28 pKa = 11.84QRR30 pKa = 11.84LEE32 pKa = 3.62PVAYY36 pKa = 10.31RR37 pKa = 11.84FDD39 pKa = 4.19AEE41 pKa = 4.4HH42 pKa = 7.26DD43 pKa = 3.8GSEE46 pKa = 4.13LLEE49 pKa = 4.54GVDD52 pKa = 4.24IDD54 pKa = 5.6LDD56 pKa = 3.75TDD58 pKa = 3.66EE59 pKa = 5.98VDD61 pKa = 2.93MSRR64 pKa = 11.84FDD66 pKa = 3.83RR67 pKa = 11.84SSSSSSAAFDD77 pKa = 4.35LDD79 pKa = 3.97DD80 pKa = 5.92DD81 pKa = 4.55GEE83 pKa = 4.17EE84 pKa = 3.85MHH86 pKa = 6.67MDD88 pKa = 3.36IYY90 pKa = 11.16YY91 pKa = 10.76DD92 pKa = 3.7EE93 pKa = 5.41ANGVYY98 pKa = 10.23VDD100 pKa = 3.2AHH102 pKa = 6.16GNQLFTPAEE111 pKa = 4.13MEE113 pKa = 3.99ALQAQFDD120 pKa = 3.93NALEE124 pKa = 4.21NEE126 pKa = 4.23EE127 pKa = 4.05AAYY130 pKa = 9.92AYY132 pKa = 7.7HH133 pKa = 5.87TTTFEE138 pKa = 4.01GNAPIPSEE146 pKa = 3.8NVYY149 pKa = 10.69FEE151 pKa = 4.74ILDD154 pKa = 4.05PPEE157 pKa = 3.71IAYY160 pKa = 8.5MYY162 pKa = 9.91TGVISFNIGVDD173 pKa = 3.95FEE175 pKa = 5.13FMLDD179 pKa = 3.38PAYY182 pKa = 10.73LVLSEE187 pKa = 5.49PYY189 pKa = 9.97DD190 pKa = 3.53ACQPLNGEE198 pKa = 4.17QFHH201 pKa = 7.1DD202 pKa = 3.48AVVMVEE208 pKa = 4.69RR209 pKa = 11.84GTCSFIEE216 pKa = 4.07KK217 pKa = 10.0AINVASAGAAAMIVADD233 pKa = 4.5NEE235 pKa = 4.14PPEE238 pKa = 4.9DD239 pKa = 4.41SILVDD244 pKa = 3.54MVSDD248 pKa = 4.31DD249 pKa = 3.95GRR251 pKa = 11.84LASIPCVFIQTQDD264 pKa = 2.99GAKK267 pKa = 9.32IRR269 pKa = 11.84NAIYY273 pKa = 8.88QHH275 pKa = 6.07GVSGVPITIPLNITMQTQEE294 pKa = 4.15AFVDD298 pKa = 4.45SFVPWAPLLL307 pKa = 4.01
Molecular weight: 33.85 kDa
Isoelectric point according different methods:
Protein with the highest isoelectric point:
>tr|A0A0D2W241|A0A0D2W241_CAPO3 Uncharacterized protein OS=Capsaspora owczarzaki (strain ATCC 30864) OX=595528 GN=CAOG_008372 PE=4 SV=1
MM1 pKa = 7.29SASASNIPRR10 pKa = 11.84TLNRR14 pKa = 11.84ISSTVSTILARR25 pKa = 11.84VAANSSTASSQPFKK39 pKa = 10.88LIPKK43 pKa = 9.24LPSAPRR49 pKa = 11.84TATARR54 pKa = 11.84RR55 pKa = 11.84GAWQPSPAQQAAQTKK70 pKa = 6.5QQKK73 pKa = 9.42
MM1 pKa = 7.29SASASNIPRR10 pKa = 11.84TLNRR14 pKa = 11.84ISSTVSTILARR25 pKa = 11.84VAANSSTASSQPFKK39 pKa = 10.88LIPKK43 pKa = 9.24LPSAPRR49 pKa = 11.84TATARR54 pKa = 11.84RR55 pKa = 11.84GAWQPSPAQQAAQTKK70 pKa = 6.5QQKK73 pKa = 9.42
Molecular weight: 7.69 kDa
Isoelectric point according different methods:
Peptides (in silico digests for buttom-up proteomics)
Below you can find in silico digests of the whole proteome with Trypsin, Chymotrypsin, Trypsin+LysC, LysN, ArgC proteases suitable for different mass spec machines.| Try ESI |
 |
|---|
| ChTry ESI |
|
|---|
| ArgC ESI |
|
|---|
| LysN ESI |
|
|---|
| TryLysC ESI |
|
|---|
| Try MALDI |
|
|---|
| ChTry MALDI |
|
|---|
| ArgC MALDI |
|
|---|
| LysN MALDI |
|
|---|
| TryLysC MALDI |
|
|---|
| Try LTQ |
|
|---|
| ChTry LTQ |
|
|---|
| ArgC LTQ |
|
|---|
| LysN LTQ |
|
|---|
| TryLysC LTQ |
|
|---|
| Try MSlow |
|
|---|
| ChTry MSlow |
|
|---|
| ArgC MSlow |
|
|---|
| LysN MSlow |
|
|---|
| TryLysC MSlow |
|
|---|
| Try MShigh |
|
|---|
| ChTry MShigh |
|
|---|
| ArgC MShigh |
|
|---|
| LysN MShigh |
|
|---|
| TryLysC MShigh |
|
|---|
General Statistics
Number of major isoforms |
Number of additional isoforms |
Number of all proteins |
Number of amino acids |
Min. Seq. Length |
Max. Seq. Length |
Avg. Seq. Length |
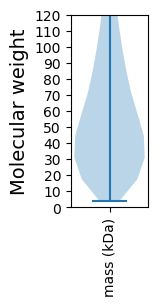
Avg. Mol. Weight |
|---|---|---|---|---|---|---|---|
6129802 |
37 |
12732 |
625.9 |
67.76 |
Amino acid frequency
Ala |
Cys |
Asp |
Glu |
Phe |
Gly |
His |
Ile |
Lys |
Leu |
|---|---|---|---|---|---|---|---|---|---|
11.821 ± 0.033 | 1.375 ± 0.019 |
5.412 ± 0.018 | 5.053 ± 0.022 |
3.538 ± 0.015 | 5.901 ± 0.021 |
2.524 ± 0.012 | 3.946 ± 0.016 |
3.684 ± 0.024 | 9.38 ± 0.029 |
Met |
Asn |
Gln |
Pro |
Arg |
Ser |
Thr |
Val |
Trp |
Tyr |
|---|---|---|---|---|---|---|---|---|---|
2.039 ± 0.009 | 3.518 ± 0.013 |
5.832 ± 0.025 | 4.745 ± 0.026 |
5.732 ± 0.019 | 9.548 ± 0.042 |
6.26 ± 0.023 | 6.615 ± 0.018 |
0.973 ± 0.006 | 2.103 ± 0.013 |
Most of the basic statistics you can see at this page can be downloaded from this CSV file
See this proteome in:

Proteome-pI is available under Creative Commons Attribution-NoDerivs license, for more details see here
| Reference: Kozlowski LP. Proteome-pI 2.0: Proteome Isoelectric Point Database Update. Nucleic Acids Res. 2021, doi: 10.1093/nar/gkab944 | Contact: Lukasz P. Kozlowski |