SIV-wrc Pbt-05GM-X02
Taxonomy: Viruses; Riboviria; Pararnavirae; Artverviricota; Revtraviricetes; Ortervirales; Retroviridae; Orthoretrovirinae; Lentivirus; Simian immunodeficiency virus; Simian immunodeficiency virus - wrc
Average proteome isoelectric point is 7.71
Get precalculated fractions of proteins
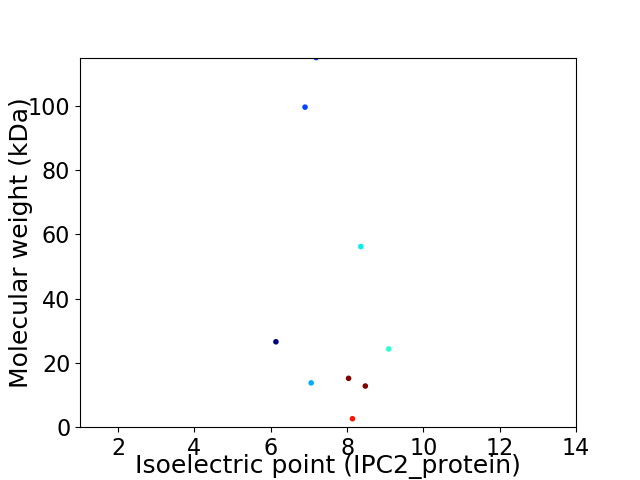
Virtual 2D-PAGE plot for 9 proteins (isoelectric point calculated using IPC2_protein)
Get csv file with sequences according to given criteria:
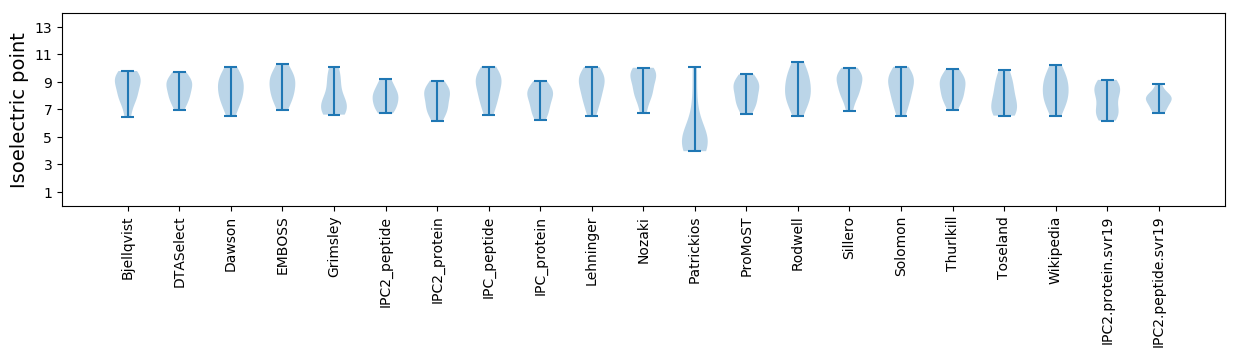
* You can choose from 21 different methods for calculating isoelectric point
Summary statistics related to proteome-wise predictions
Protein with the lowest isoelectric point:
>tr|B3CKG7|B3CKG7_SIV Gag polyprotein OS=SIV-wrc Pbt-05GM-X02 OX=498715 GN=gag PE=4 SV=1
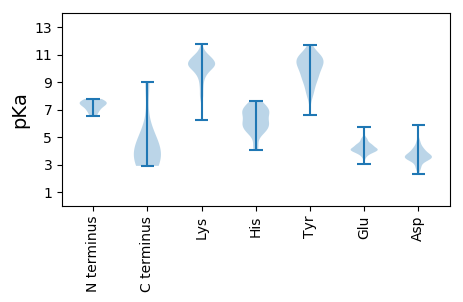
MM1 pKa = 7.44GGVFSKK7 pKa = 11.08DD8 pKa = 3.27SVEE11 pKa = 3.98QRR13 pKa = 11.84MLRR16 pKa = 11.84YY17 pKa = 9.2RR18 pKa = 11.84RR19 pKa = 11.84RR20 pKa = 11.84LLRR23 pKa = 11.84VGRR26 pKa = 11.84KK27 pKa = 6.22EE28 pKa = 3.18RR29 pKa = 11.84RR30 pKa = 11.84RR31 pKa = 11.84RR32 pKa = 11.84YY33 pKa = 7.87TRR35 pKa = 11.84LAAEE39 pKa = 4.38RR40 pKa = 11.84QAEE43 pKa = 4.04AAASGEE49 pKa = 4.19LLPDD53 pKa = 3.73SAQTLIRR60 pKa = 11.84AEE62 pKa = 4.07EE63 pKa = 4.34DD64 pKa = 3.18SSKK67 pKa = 10.99EE68 pKa = 4.09DD69 pKa = 4.09SSDD72 pKa = 3.27DD73 pKa = 3.71DD74 pKa = 5.85AIGFPVRR81 pKa = 11.84PQVPLRR87 pKa = 11.84QATFKK92 pKa = 10.91ILVDD96 pKa = 4.33LSHH99 pKa = 7.11LFKK102 pKa = 11.05EE103 pKa = 4.43KK104 pKa = 10.86GGLEE108 pKa = 4.37DD109 pKa = 4.53IFWSPRR115 pKa = 11.84RR116 pKa = 11.84EE117 pKa = 4.05EE118 pKa = 4.05IVNLYY123 pKa = 10.24AYY125 pKa = 9.46HH126 pKa = 6.55EE127 pKa = 4.22WGIVEE132 pKa = 4.67GWQAYY137 pKa = 8.08TDD139 pKa = 4.35GPGVRR144 pKa = 11.84YY145 pKa = 8.76PKK147 pKa = 10.1TFGWCWKK154 pKa = 9.27LVPVHH159 pKa = 6.8FSEE162 pKa = 5.14EE163 pKa = 4.47SPNSDD168 pKa = 3.49QGFEE172 pKa = 4.33KK173 pKa = 10.9NLLLHH178 pKa = 6.32PAVAEE183 pKa = 4.82SEE185 pKa = 4.9DD186 pKa = 3.39PWKK189 pKa = 10.73EE190 pKa = 3.65YY191 pKa = 10.81LVWKK195 pKa = 9.8FDD197 pKa = 3.57PRR199 pKa = 11.84LACDD203 pKa = 4.13FVAGRR208 pKa = 11.84LADD211 pKa = 3.87GQIATGIEE219 pKa = 3.84TLYY222 pKa = 11.08EE223 pKa = 3.83MKK225 pKa = 10.49KK226 pKa = 10.46RR227 pKa = 11.84NNKK230 pKa = 9.0
MM1 pKa = 7.44GGVFSKK7 pKa = 11.08DD8 pKa = 3.27SVEE11 pKa = 3.98QRR13 pKa = 11.84MLRR16 pKa = 11.84YY17 pKa = 9.2RR18 pKa = 11.84RR19 pKa = 11.84RR20 pKa = 11.84LLRR23 pKa = 11.84VGRR26 pKa = 11.84KK27 pKa = 6.22EE28 pKa = 3.18RR29 pKa = 11.84RR30 pKa = 11.84RR31 pKa = 11.84RR32 pKa = 11.84YY33 pKa = 7.87TRR35 pKa = 11.84LAAEE39 pKa = 4.38RR40 pKa = 11.84QAEE43 pKa = 4.04AAASGEE49 pKa = 4.19LLPDD53 pKa = 3.73SAQTLIRR60 pKa = 11.84AEE62 pKa = 4.07EE63 pKa = 4.34DD64 pKa = 3.18SSKK67 pKa = 10.99EE68 pKa = 4.09DD69 pKa = 4.09SSDD72 pKa = 3.27DD73 pKa = 3.71DD74 pKa = 5.85AIGFPVRR81 pKa = 11.84PQVPLRR87 pKa = 11.84QATFKK92 pKa = 10.91ILVDD96 pKa = 4.33LSHH99 pKa = 7.11LFKK102 pKa = 11.05EE103 pKa = 4.43KK104 pKa = 10.86GGLEE108 pKa = 4.37DD109 pKa = 4.53IFWSPRR115 pKa = 11.84RR116 pKa = 11.84EE117 pKa = 4.05EE118 pKa = 4.05IVNLYY123 pKa = 10.24AYY125 pKa = 9.46HH126 pKa = 6.55EE127 pKa = 4.22WGIVEE132 pKa = 4.67GWQAYY137 pKa = 8.08TDD139 pKa = 4.35GPGVRR144 pKa = 11.84YY145 pKa = 8.76PKK147 pKa = 10.1TFGWCWKK154 pKa = 9.27LVPVHH159 pKa = 6.8FSEE162 pKa = 5.14EE163 pKa = 4.47SPNSDD168 pKa = 3.49QGFEE172 pKa = 4.33KK173 pKa = 10.9NLLLHH178 pKa = 6.32PAVAEE183 pKa = 4.82SEE185 pKa = 4.9DD186 pKa = 3.39PWKK189 pKa = 10.73EE190 pKa = 3.65YY191 pKa = 10.81LVWKK195 pKa = 9.8FDD197 pKa = 3.57PRR199 pKa = 11.84LACDD203 pKa = 4.13FVAGRR208 pKa = 11.84LADD211 pKa = 3.87GQIATGIEE219 pKa = 3.84TLYY222 pKa = 11.08EE223 pKa = 3.83MKK225 pKa = 10.49KK226 pKa = 10.46RR227 pKa = 11.84NNKK230 pKa = 9.0
Molecular weight: 26.59 kDa
Isoelectric point according different methods:
Protein with the highest isoelectric point:
>tr|B3CKH0|B3CKH0_SIV Vpr protein OS=SIV-wrc Pbt-05GM-X02 OX=498715 GN=vpr PE=4 SV=1
MM1 pKa = 7.05EE2 pKa = 5.38KK3 pKa = 10.41EE4 pKa = 4.07WIAVPLIKK12 pKa = 9.63ISKK15 pKa = 8.84GRR17 pKa = 11.84FRR19 pKa = 11.84RR20 pKa = 11.84WSYY23 pKa = 10.54WIAEE27 pKa = 4.84LIQEE31 pKa = 4.16KK32 pKa = 8.26QARR35 pKa = 11.84FLFGSWHH42 pKa = 4.24VHH44 pKa = 5.16AEE46 pKa = 3.9CFTRR50 pKa = 11.84HH51 pKa = 5.46IVRR54 pKa = 11.84IPLQGHH60 pKa = 5.66WEE62 pKa = 4.0MQIRR66 pKa = 11.84CYY68 pKa = 10.27WNLAPEE74 pKa = 4.48IGWIDD79 pKa = 3.33TLGFNIRR86 pKa = 11.84MVWEE90 pKa = 4.36NKK92 pKa = 8.25WEE94 pKa = 4.04TFITVKK100 pKa = 10.62LADD103 pKa = 3.83VLIHH107 pKa = 5.78SQHH110 pKa = 5.97FEE112 pKa = 3.93CWTQSAVKK120 pKa = 8.67NTIRR124 pKa = 11.84QGYY127 pKa = 7.36LHH129 pKa = 7.37PIDD132 pKa = 3.46SCKK135 pKa = 10.17YY136 pKa = 8.0HH137 pKa = 6.09QGHH140 pKa = 6.93LGVLTLQALCLQALQHH156 pKa = 5.33EE157 pKa = 4.73QLRR160 pKa = 11.84KK161 pKa = 9.66RR162 pKa = 11.84KK163 pKa = 9.41APNRR167 pKa = 11.84RR168 pKa = 11.84TPGNTRR174 pKa = 11.84GSSRR178 pKa = 11.84YY179 pKa = 9.49ARR181 pKa = 11.84AVCHH185 pKa = 6.38GKK187 pKa = 7.75TAFPPGSPCKK197 pKa = 10.57SISLLLATEE206 pKa = 4.27KK207 pKa = 11.01LL208 pKa = 3.79
MM1 pKa = 7.05EE2 pKa = 5.38KK3 pKa = 10.41EE4 pKa = 4.07WIAVPLIKK12 pKa = 9.63ISKK15 pKa = 8.84GRR17 pKa = 11.84FRR19 pKa = 11.84RR20 pKa = 11.84WSYY23 pKa = 10.54WIAEE27 pKa = 4.84LIQEE31 pKa = 4.16KK32 pKa = 8.26QARR35 pKa = 11.84FLFGSWHH42 pKa = 4.24VHH44 pKa = 5.16AEE46 pKa = 3.9CFTRR50 pKa = 11.84HH51 pKa = 5.46IVRR54 pKa = 11.84IPLQGHH60 pKa = 5.66WEE62 pKa = 4.0MQIRR66 pKa = 11.84CYY68 pKa = 10.27WNLAPEE74 pKa = 4.48IGWIDD79 pKa = 3.33TLGFNIRR86 pKa = 11.84MVWEE90 pKa = 4.36NKK92 pKa = 8.25WEE94 pKa = 4.04TFITVKK100 pKa = 10.62LADD103 pKa = 3.83VLIHH107 pKa = 5.78SQHH110 pKa = 5.97FEE112 pKa = 3.93CWTQSAVKK120 pKa = 8.67NTIRR124 pKa = 11.84QGYY127 pKa = 7.36LHH129 pKa = 7.37PIDD132 pKa = 3.46SCKK135 pKa = 10.17YY136 pKa = 8.0HH137 pKa = 6.09QGHH140 pKa = 6.93LGVLTLQALCLQALQHH156 pKa = 5.33EE157 pKa = 4.73QLRR160 pKa = 11.84KK161 pKa = 9.66RR162 pKa = 11.84KK163 pKa = 9.41APNRR167 pKa = 11.84RR168 pKa = 11.84TPGNTRR174 pKa = 11.84GSSRR178 pKa = 11.84YY179 pKa = 9.49ARR181 pKa = 11.84AVCHH185 pKa = 6.38GKK187 pKa = 7.75TAFPPGSPCKK197 pKa = 10.57SISLLLATEE206 pKa = 4.27KK207 pKa = 11.01LL208 pKa = 3.79
Molecular weight: 24.37 kDa
Isoelectric point according different methods:
Peptides (in silico digests for buttom-up proteomics)
Below you can find in silico digests of the whole proteome with Trypsin, Chymotrypsin, Trypsin+LysC, LysN, ArgC proteases suitable for different mass spec machines.| Try ESI |
 |
|---|
| ChTry ESI |
|
|---|
| ArgC ESI |
|
|---|
| LysN ESI |
|
|---|
| TryLysC ESI |
|
|---|
| Try MALDI |
|
|---|
| ChTry MALDI |
|
|---|
| ArgC MALDI |
|
|---|
| LysN MALDI |
|
|---|
| TryLysC MALDI |
|
|---|
| Try LTQ |
|
|---|
| ChTry LTQ |
|
|---|
| ArgC LTQ |
|
|---|
| LysN LTQ |
|
|---|
| TryLysC LTQ |
|
|---|
| Try MSlow |
|
|---|
| ChTry MSlow |
|
|---|
| ArgC MSlow |
|
|---|
| LysN MSlow |
|
|---|
| TryLysC MSlow |
|
|---|
| Try MShigh |
|
|---|
| ChTry MShigh |
|
|---|
| ArgC MShigh |
|
|---|
| LysN MShigh |
|
|---|
| TryLysC MShigh |
|
|---|
General Statistics
Number of major isoforms |
Number of additional isoforms |
Number of all proteins |
Number of amino acids |
Min. Seq. Length |
Max. Seq. Length |
Avg. Seq. Length |
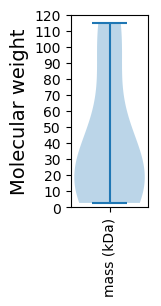
Avg. Mol. Weight |
|---|---|---|---|---|---|---|---|
0 |
3209 |
23 |
1012 |
356.6 |
40.71 |
Amino acid frequency
Ala |
Cys |
Asp |
Glu |
Phe |
Gly |
His |
Ile |
Lys |
Leu |
|---|---|---|---|---|---|---|---|---|---|
5.703 ± 0.422 | 2.586 ± 0.649 |
3.615 ± 0.321 | 7.822 ± 0.466 |
2.898 ± 0.395 | 7.074 ± 0.409 |
2.4 ± 0.298 | 6.793 ± 0.855 |
7.323 ± 0.657 | 8.632 ± 0.421 |
Met |
Asn |
Gln |
Pro |
Arg |
Ser |
Thr |
Val |
Trp |
Tyr |
|---|---|---|---|---|---|---|---|---|---|
1.994 ± 0.224 | 4.207 ± 0.588 |
4.612 ± 0.745 | 6.139 ± 0.497 |
5.765 ± 0.815 | 5.64 ± 0.477 |
5.765 ± 0.552 | 5.36 ± 0.532 |
2.773 ± 0.384 | 2.898 ± 0.265 |
Most of the basic statistics you can see at this page can be downloaded from this CSV file
See this proteome in:

Proteome-pI is available under Creative Commons Attribution-NoDerivs license, for more details see here
| Reference: Kozlowski LP. Proteome-pI 2.0: Proteome Isoelectric Point Database Update. Nucleic Acids Res. 2021, doi: 10.1093/nar/gkab944 | Contact: Lukasz P. Kozlowski |