Nocardia sp. NRRL S-836
Taxonomy: cellular organisms; Bacteria; Terrabacteria group; Actinobacteria; Actinomycetia; Corynebacteriales; Nocardiaceae; Nocardia; unclassified Nocardia
Average proteome isoelectric point is 6.33
Get precalculated fractions of proteins
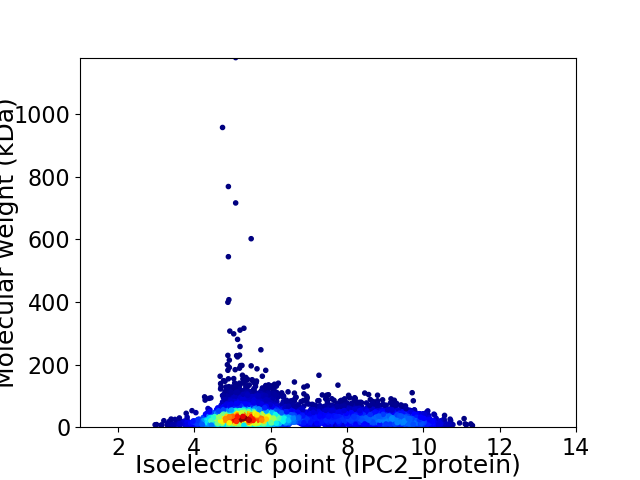
Virtual 2D-PAGE plot for 7876 proteins (isoelectric point calculated using IPC2_protein)
Get csv file with sequences according to given criteria:
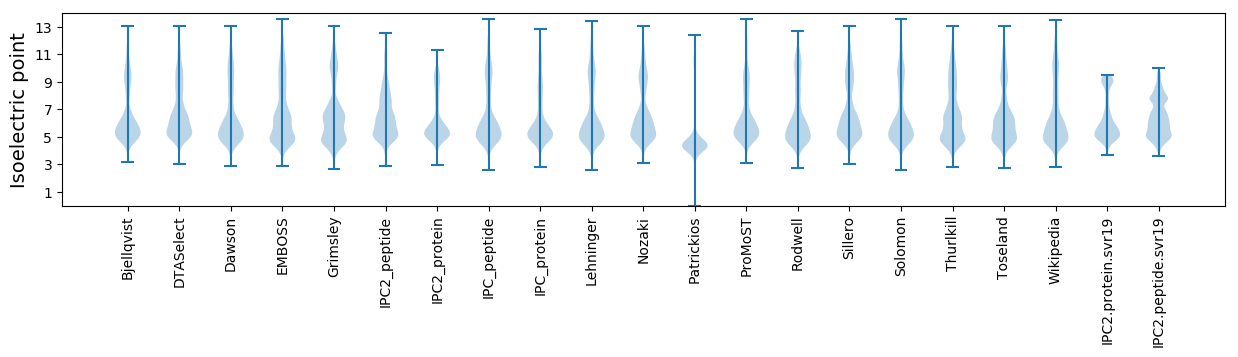
* You can choose from 21 different methods for calculating isoelectric point
Summary statistics related to proteome-wise predictions
Protein with the lowest isoelectric point:
>tr|A0A0M8WA29|A0A0M8WA29_9NOCA Lysine 2 3-aminomutase OS=Nocardia sp. NRRL S-836 OX=1519492 GN=ADL03_27485 PE=4 SV=1
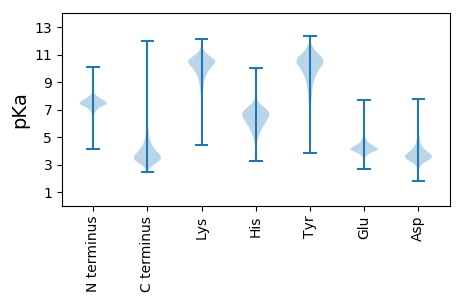
MM1 pKa = 7.21SHH3 pKa = 5.76NTATSGDD10 pKa = 3.93SGDD13 pKa = 3.97SVDD16 pKa = 5.36WNDD19 pKa = 5.84DD20 pKa = 3.35DD21 pKa = 6.01WNDD24 pKa = 5.1NDD26 pKa = 5.58NDD28 pKa = 4.12WDD30 pKa = 5.08DD31 pKa = 4.88DD32 pKa = 4.72DD33 pKa = 7.05SDD35 pKa = 4.35GGPTGDD41 pKa = 3.82TGDD44 pKa = 4.87AINVSSTNGGNTGHH58 pKa = 6.98GGNGGDD64 pKa = 4.32ADD66 pKa = 4.12ATSEE70 pKa = 4.27SHH72 pKa = 5.3VAVYY76 pKa = 10.63EE77 pKa = 5.09DD78 pKa = 6.1DD79 pKa = 6.44DD80 pKa = 7.4DD81 pKa = 7.66DD82 pKa = 7.76DD83 pKa = 5.38DD84 pKa = 6.25DD85 pKa = 6.63KK86 pKa = 11.99DD87 pKa = 3.78GAHH90 pKa = 5.18QQEE93 pKa = 5.06GAHH96 pKa = 5.24QQDD99 pKa = 4.23GVHH102 pKa = 6.1HH103 pKa = 6.53QDD105 pKa = 3.56GAHH108 pKa = 6.09HH109 pKa = 6.47QDD111 pKa = 3.88GVHH114 pKa = 6.51HH115 pKa = 6.83GSDD118 pKa = 3.19ATAVAVGGNGAPSGEE133 pKa = 4.12GGNALSHH140 pKa = 5.65NTATSGEE147 pKa = 4.35SGDD150 pKa = 4.46SGDD153 pKa = 5.49SGDD156 pKa = 4.07TGHH159 pKa = 6.74NSAIVMCVKK168 pKa = 9.49ATCLTGLWSGHH179 pKa = 6.24SGDD182 pKa = 3.95TSTGNTGDD190 pKa = 3.62AVNVSSTNGGNTGNGGNGGNADD212 pKa = 3.95ADD214 pKa = 4.16ANTNGHH220 pKa = 4.83GHH222 pKa = 6.0ATAVAAAGHH231 pKa = 6.38GKK233 pKa = 9.79PSGEE237 pKa = 3.99GGNALSHH244 pKa = 6.41NSATSGEE251 pKa = 4.43SGDD254 pKa = 4.46SGDD257 pKa = 5.49SGDD260 pKa = 4.07TGHH263 pKa = 6.74NSAIVMCVQADD274 pKa = 3.83CSTGVWSGASGDD286 pKa = 3.8TGTGNTGDD294 pKa = 4.12AVNEE298 pKa = 4.23STTTGGNTGHH308 pKa = 7.02GGNGGNADD316 pKa = 3.21AWATSWHH323 pKa = 6.43EE324 pKa = 3.96GDD326 pKa = 4.45HH327 pKa = 5.77NN328 pKa = 3.92
MM1 pKa = 7.21SHH3 pKa = 5.76NTATSGDD10 pKa = 3.93SGDD13 pKa = 3.97SVDD16 pKa = 5.36WNDD19 pKa = 5.84DD20 pKa = 3.35DD21 pKa = 6.01WNDD24 pKa = 5.1NDD26 pKa = 5.58NDD28 pKa = 4.12WDD30 pKa = 5.08DD31 pKa = 4.88DD32 pKa = 4.72DD33 pKa = 7.05SDD35 pKa = 4.35GGPTGDD41 pKa = 3.82TGDD44 pKa = 4.87AINVSSTNGGNTGHH58 pKa = 6.98GGNGGDD64 pKa = 4.32ADD66 pKa = 4.12ATSEE70 pKa = 4.27SHH72 pKa = 5.3VAVYY76 pKa = 10.63EE77 pKa = 5.09DD78 pKa = 6.1DD79 pKa = 6.44DD80 pKa = 7.4DD81 pKa = 7.66DD82 pKa = 7.76DD83 pKa = 5.38DD84 pKa = 6.25DD85 pKa = 6.63KK86 pKa = 11.99DD87 pKa = 3.78GAHH90 pKa = 5.18QQEE93 pKa = 5.06GAHH96 pKa = 5.24QQDD99 pKa = 4.23GVHH102 pKa = 6.1HH103 pKa = 6.53QDD105 pKa = 3.56GAHH108 pKa = 6.09HH109 pKa = 6.47QDD111 pKa = 3.88GVHH114 pKa = 6.51HH115 pKa = 6.83GSDD118 pKa = 3.19ATAVAVGGNGAPSGEE133 pKa = 4.12GGNALSHH140 pKa = 5.65NTATSGEE147 pKa = 4.35SGDD150 pKa = 4.46SGDD153 pKa = 5.49SGDD156 pKa = 4.07TGHH159 pKa = 6.74NSAIVMCVKK168 pKa = 9.49ATCLTGLWSGHH179 pKa = 6.24SGDD182 pKa = 3.95TSTGNTGDD190 pKa = 3.62AVNVSSTNGGNTGNGGNGGNADD212 pKa = 3.95ADD214 pKa = 4.16ANTNGHH220 pKa = 4.83GHH222 pKa = 6.0ATAVAAAGHH231 pKa = 6.38GKK233 pKa = 9.79PSGEE237 pKa = 3.99GGNALSHH244 pKa = 6.41NSATSGEE251 pKa = 4.43SGDD254 pKa = 4.46SGDD257 pKa = 5.49SGDD260 pKa = 4.07TGHH263 pKa = 6.74NSAIVMCVQADD274 pKa = 3.83CSTGVWSGASGDD286 pKa = 3.8TGTGNTGDD294 pKa = 4.12AVNEE298 pKa = 4.23STTTGGNTGHH308 pKa = 7.02GGNGGNADD316 pKa = 3.21AWATSWHH323 pKa = 6.43EE324 pKa = 3.96GDD326 pKa = 4.45HH327 pKa = 5.77NN328 pKa = 3.92
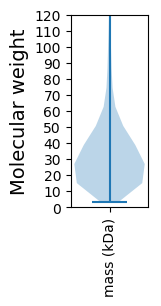
Molecular weight: 31.83 kDa
Isoelectric point according different methods:
Protein with the highest isoelectric point:
>tr|A0A0N0A4X6|A0A0N0A4X6_9NOCA Peptidyl-tRNA hydrolase OS=Nocardia sp. NRRL S-836 OX=1519492 GN=pth PE=3 SV=1
MM1 pKa = 7.53SKK3 pKa = 10.53GKK5 pKa = 8.66RR6 pKa = 11.84TFQPNNRR13 pKa = 11.84RR14 pKa = 11.84RR15 pKa = 11.84AKK17 pKa = 8.7THH19 pKa = 5.15GFRR22 pKa = 11.84LRR24 pKa = 11.84MRR26 pKa = 11.84TRR28 pKa = 11.84AGRR31 pKa = 11.84AILAARR37 pKa = 11.84RR38 pKa = 11.84SKK40 pKa = 10.82GRR42 pKa = 11.84ATLSAA47 pKa = 4.08
MM1 pKa = 7.53SKK3 pKa = 10.53GKK5 pKa = 8.66RR6 pKa = 11.84TFQPNNRR13 pKa = 11.84RR14 pKa = 11.84RR15 pKa = 11.84AKK17 pKa = 8.7THH19 pKa = 5.15GFRR22 pKa = 11.84LRR24 pKa = 11.84MRR26 pKa = 11.84TRR28 pKa = 11.84AGRR31 pKa = 11.84AILAARR37 pKa = 11.84RR38 pKa = 11.84SKK40 pKa = 10.82GRR42 pKa = 11.84ATLSAA47 pKa = 4.08
Molecular weight: 5.4 kDa
Isoelectric point according different methods:
Peptides (in silico digests for buttom-up proteomics)
Below you can find in silico digests of the whole proteome with Trypsin, Chymotrypsin, Trypsin+LysC, LysN, ArgC proteases suitable for different mass spec machines.| Try ESI |
 |
|---|
| ChTry ESI |
|
|---|
| ArgC ESI |
|
|---|
| LysN ESI |
|
|---|
| TryLysC ESI |
|
|---|
| Try MALDI |
|
|---|
| ChTry MALDI |
|
|---|
| ArgC MALDI |
|
|---|
| LysN MALDI |
|
|---|
| TryLysC MALDI |
|
|---|
| Try LTQ |
|
|---|
| ChTry LTQ |
|
|---|
| ArgC LTQ |
|
|---|
| LysN LTQ |
|
|---|
| TryLysC LTQ |
|
|---|
| Try MSlow |
|
|---|
| ChTry MSlow |
|
|---|
| ArgC MSlow |
|
|---|
| LysN MSlow |
|
|---|
| TryLysC MSlow |
|
|---|
| Try MShigh |
|
|---|
| ChTry MShigh |
|
|---|
| ArgC MShigh |
|
|---|
| LysN MShigh |
|
|---|
| TryLysC MShigh |
|
|---|
General Statistics
Number of major isoforms |
Number of additional isoforms |
Number of all proteins |
Number of amino acids |
Min. Seq. Length |
Max. Seq. Length |
Avg. Seq. Length |
Avg. Mol. Weight |
|---|---|---|---|---|---|---|---|
0 |
2515523 |
27 |
11006 |
319.4 |
34.33 |
Amino acid frequency
Ala |
Cys |
Asp |
Glu |
Phe |
Gly |
His |
Ile |
Lys |
Leu |
|---|---|---|---|---|---|---|---|---|---|
12.965 ± 0.043 | 0.799 ± 0.008 |
6.041 ± 0.025 | 5.554 ± 0.027 |
2.94 ± 0.017 | 8.973 ± 0.031 |
2.371 ± 0.015 | 3.16 ± 0.019 |
2.171 ± 0.023 | 10.507 ± 0.043 |
Met |
Asn |
Gln |
Pro |
Arg |
Ser |
Thr |
Val |
Trp |
Tyr |
|---|---|---|---|---|---|---|---|---|---|
1.706 ± 0.012 | 2.056 ± 0.019 |
5.678 ± 0.025 | 2.939 ± 0.016 |
7.834 ± 0.029 | 5.183 ± 0.022 |
6.088 ± 0.029 | 9.481 ± 0.03 |
1.59 ± 0.013 | 1.964 ± 0.015 |
Most of the basic statistics you can see at this page can be downloaded from this CSV file
See this proteome in:

Proteome-pI is available under Creative Commons Attribution-NoDerivs license, for more details see here
| Reference: Kozlowski LP. Proteome-pI 2.0: Proteome Isoelectric Point Database Update. Nucleic Acids Res. 2021, doi: 10.1093/nar/gkab944 | Contact: Lukasz P. Kozlowski |