Ribes americanum virus A
Taxonomy: Viruses; Riboviria; Orthornavirae; Kitrinoviricota; Alsuviricetes; Tymovirales; Betaflexiviridae; Trivirinae; Ravavirus
Average proteome isoelectric point is 7.27
Get precalculated fractions of proteins
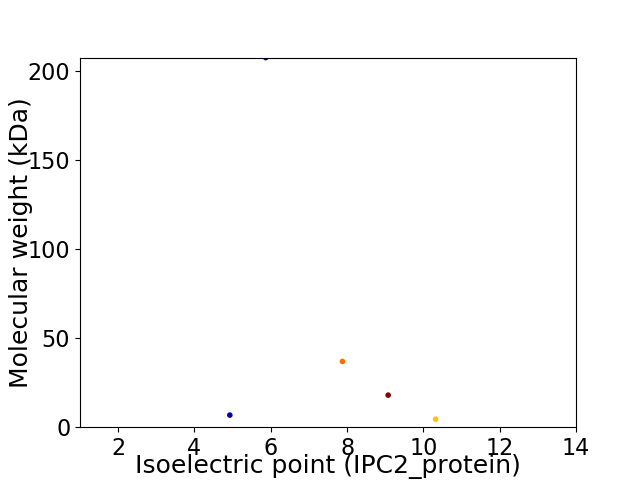
Virtual 2D-PAGE plot for 5 proteins (isoelectric point calculated using IPC2_protein)
Get csv file with sequences according to given criteria:
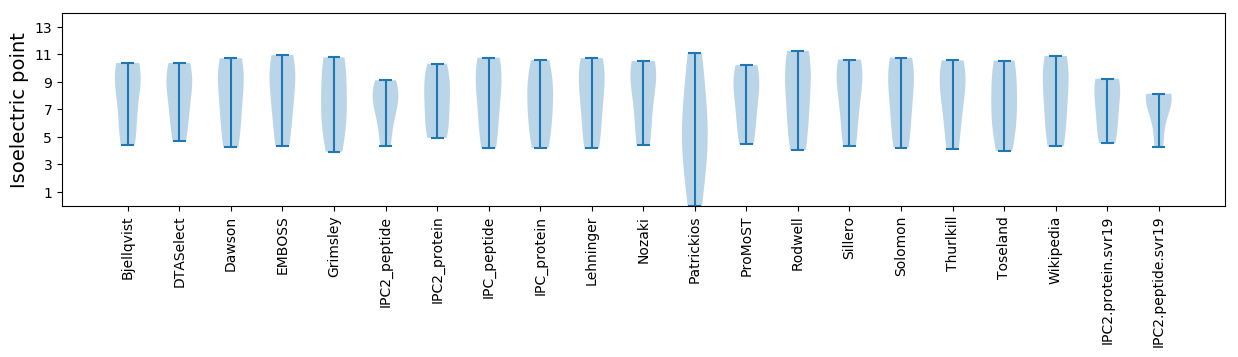
* You can choose from 21 different methods for calculating isoelectric point
Summary statistics related to proteome-wise predictions
Protein with the lowest isoelectric point:
>tr|A0A345F6V3|A0A345F6V3_9VIRU Triple gene block 1-like protein OS=Ribes americanum virus A OX=1569057 PE=4 SV=1
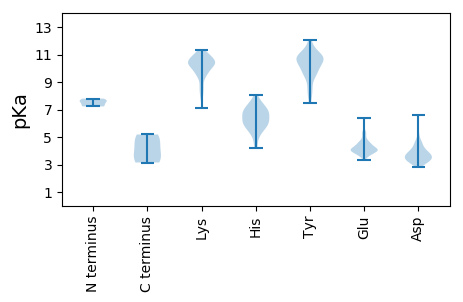
MM1 pKa = 7.8CYY3 pKa = 9.76IDD5 pKa = 3.69VAFDD9 pKa = 3.79LVCLFICVLILVALLKK25 pKa = 9.73LTYY28 pKa = 9.69CNSSAFCVALALTIYY43 pKa = 10.99SLFLNFNLLVLLYY56 pKa = 10.51DD57 pKa = 4.05LSRR60 pKa = 5.18
MM1 pKa = 7.8CYY3 pKa = 9.76IDD5 pKa = 3.69VAFDD9 pKa = 3.79LVCLFICVLILVALLKK25 pKa = 9.73LTYY28 pKa = 9.69CNSSAFCVALALTIYY43 pKa = 10.99SLFLNFNLLVLLYY56 pKa = 10.51DD57 pKa = 4.05LSRR60 pKa = 5.18
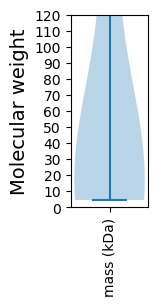
Molecular weight: 6.79 kDa
Isoelectric point according different methods:
Protein with the highest isoelectric point:
>tr|A0A345F6V2|A0A345F6V2_9VIRU Triple gene block 2-like protein OS=Ribes americanum virus A OX=1569057 PE=4 SV=1
MM1 pKa = 7.26NFKK4 pKa = 10.76SYY6 pKa = 10.86LLKK9 pKa = 10.49KK10 pKa = 9.48IKK12 pKa = 10.53SVGIGLASSLIIYY25 pKa = 9.23IASFVFNVLYY35 pKa = 10.47RR36 pKa = 11.84RR37 pKa = 11.84SFF39 pKa = 3.15
MM1 pKa = 7.26NFKK4 pKa = 10.76SYY6 pKa = 10.86LLKK9 pKa = 10.49KK10 pKa = 9.48IKK12 pKa = 10.53SVGIGLASSLIIYY25 pKa = 9.23IASFVFNVLYY35 pKa = 10.47RR36 pKa = 11.84RR37 pKa = 11.84SFF39 pKa = 3.15
Molecular weight: 4.49 kDa
Isoelectric point according different methods:
Peptides (in silico digests for buttom-up proteomics)
Below you can find in silico digests of the whole proteome with Trypsin, Chymotrypsin, Trypsin+LysC, LysN, ArgC proteases suitable for different mass spec machines.| Try ESI |
 |
|---|
| ChTry ESI |
|
|---|
| ArgC ESI |
|
|---|
| LysN ESI |
|
|---|
| TryLysC ESI |
|
|---|
| Try MALDI |
|
|---|
| ChTry MALDI |
|
|---|
| ArgC MALDI |
|
|---|
| LysN MALDI |
|
|---|
| TryLysC MALDI |
|
|---|
| Try LTQ |
|
|---|
| ChTry LTQ |
|
|---|
| ArgC LTQ |
|
|---|
| LysN LTQ |
|
|---|
| TryLysC LTQ |
|
|---|
| Try MSlow |
|
|---|
| ChTry MSlow |
|
|---|
| ArgC MSlow |
|
|---|
| LysN MSlow |
|
|---|
| TryLysC MSlow |
|
|---|
| Try MShigh |
|
|---|
| ChTry MShigh |
|
|---|
| ArgC MShigh |
|
|---|
| LysN MShigh |
|
|---|
| TryLysC MShigh |
|
|---|
General Statistics
Number of major isoforms |
Number of additional isoforms |
Number of all proteins |
Number of amino acids |
Min. Seq. Length |
Max. Seq. Length |
Avg. Seq. Length |
Avg. Mol. Weight |
|---|---|---|---|---|---|---|---|
0 |
2405 |
39 |
1826 |
481.0 |
54.69 |
Amino acid frequency
Ala |
Cys |
Asp |
Glu |
Phe |
Gly |
His |
Ile |
Lys |
Leu |
|---|---|---|---|---|---|---|---|---|---|
5.613 ± 0.399 | 2.328 ± 0.953 |
6.486 ± 0.897 | 6.32 ± 1.047 |
5.821 ± 0.736 | 6.195 ± 1.065 |
1.954 ± 0.41 | 5.114 ± 0.982 |
6.486 ± 0.867 | 10.894 ± 2.003 |
Met |
Asn |
Gln |
Pro |
Arg |
Ser |
Thr |
Val |
Trp |
Tyr |
|---|---|---|---|---|---|---|---|---|---|
3.119 ± 0.355 | 3.909 ± 0.552 |
3.285 ± 1.05 | 1.913 ± 0.606 |
6.611 ± 0.899 | 8.524 ± 0.598 |
3.867 ± 0.515 | 7.069 ± 0.61 |
1.081 ± 0.321 | 3.41 ± 0.686 |
Most of the basic statistics you can see at this page can be downloaded from this CSV file
See this proteome in:

Proteome-pI is available under Creative Commons Attribution-NoDerivs license, for more details see here
| Reference: Kozlowski LP. Proteome-pI 2.0: Proteome Isoelectric Point Database Update. Nucleic Acids Res. 2021, doi: 10.1093/nar/gkab944 | Contact: Lukasz P. Kozlowski |