Halogeometricum sp. wsp3
Taxonomy: cellular organisms; Archaea; Euryarchaeota; Stenosarchaea group; Halobacteria; Haloferacales; Haloferacaceae; Halogeometricum; unclassified Halogeometricum
Average proteome isoelectric point is 7.19
Get precalculated fractions of proteins
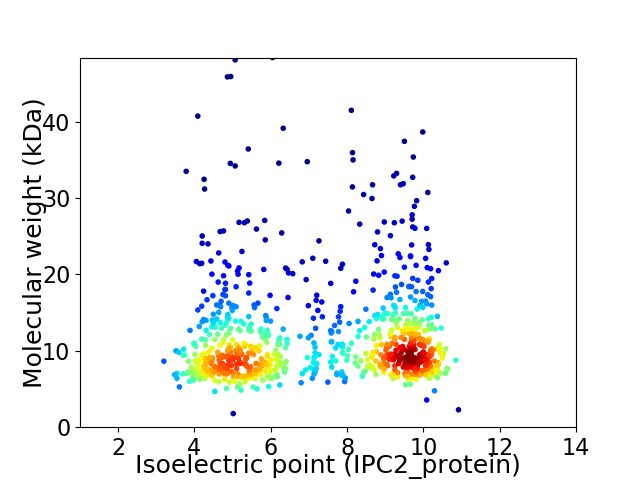
Virtual 2D-PAGE plot for 845 proteins (isoelectric point calculated using IPC2_protein)
Get csv file with sequences according to given criteria:
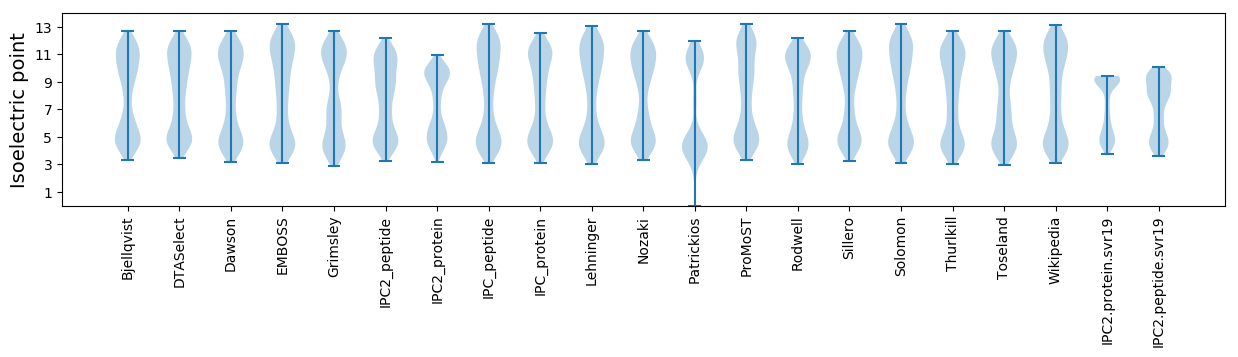
* You can choose from 21 different methods for calculating isoelectric point
Summary statistics related to proteome-wise predictions
Protein with the lowest isoelectric point:
>tr|A0A2W0FVK6|A0A2W0FVK6_9EURY Uncharacterized protein OS=Halogeometricum sp. wsp3 OX=2218585 GN=C8039_13940 PE=4 SV=1
MM1 pKa = 7.76PSDD4 pKa = 4.17DD5 pKa = 4.36APPLRR10 pKa = 11.84FEE12 pKa = 4.49KK13 pKa = 10.79VDD15 pKa = 3.16GRR17 pKa = 11.84LLVTVDD23 pKa = 3.16GTDD26 pKa = 3.35EE27 pKa = 4.19VTSGSDD33 pKa = 3.54GCCRR37 pKa = 11.84TAAVGDD43 pKa = 3.72PVLWGKK49 pKa = 9.41WDD51 pKa = 3.25IFCIVFSTYY60 pKa = 11.25DD61 pKa = 4.3LYY63 pKa = 11.23CQSYY67 pKa = 9.79SS68 pKa = 3.24
MM1 pKa = 7.76PSDD4 pKa = 4.17DD5 pKa = 4.36APPLRR10 pKa = 11.84FEE12 pKa = 4.49KK13 pKa = 10.79VDD15 pKa = 3.16GRR17 pKa = 11.84LLVTVDD23 pKa = 3.16GTDD26 pKa = 3.35EE27 pKa = 4.19VTSGSDD33 pKa = 3.54GCCRR37 pKa = 11.84TAAVGDD43 pKa = 3.72PVLWGKK49 pKa = 9.41WDD51 pKa = 3.25IFCIVFSTYY60 pKa = 11.25DD61 pKa = 4.3LYY63 pKa = 11.23CQSYY67 pKa = 9.79SS68 pKa = 3.24
Molecular weight: 7.47 kDa
Isoelectric point according different methods:
Protein with the highest isoelectric point:
>tr|A0A2W0FQ42|A0A2W0FQ42_9EURY Uncharacterized protein OS=Halogeometricum sp. wsp3 OX=2218585 GN=C8039_18615 PE=4 SV=1
MM1 pKa = 7.27FAFNARR7 pKa = 11.84TSPSRR12 pKa = 11.84LPGRR16 pKa = 11.84RR17 pKa = 11.84RR18 pKa = 11.84RR19 pKa = 3.67
MM1 pKa = 7.27FAFNARR7 pKa = 11.84TSPSRR12 pKa = 11.84LPGRR16 pKa = 11.84RR17 pKa = 11.84RR18 pKa = 11.84RR19 pKa = 3.67
Molecular weight: 2.28 kDa
Isoelectric point according different methods:
Peptides (in silico digests for buttom-up proteomics)
Below you can find in silico digests of the whole proteome with Trypsin, Chymotrypsin, Trypsin+LysC, LysN, ArgC proteases suitable for different mass spec machines.| Try ESI |
 |
|---|
| ChTry ESI |
|
|---|
| ArgC ESI |
|
|---|
| LysN ESI |
|
|---|
| TryLysC ESI |
|
|---|
| Try MALDI |
|
|---|
| ChTry MALDI |
|
|---|
| ArgC MALDI |
|
|---|
| LysN MALDI |
|
|---|
| TryLysC MALDI |
|
|---|
| Try LTQ |
|
|---|
| ChTry LTQ |
|
|---|
| ArgC LTQ |
|
|---|
| LysN LTQ |
|
|---|
| TryLysC LTQ |
|
|---|
| Try MSlow |
|
|---|
| ChTry MSlow |
|
|---|
| ArgC MSlow |
|
|---|
| LysN MSlow |
|
|---|
| TryLysC MSlow |
|
|---|
| Try MShigh |
|
|---|
| ChTry MShigh |
|
|---|
| ArgC MShigh |
|
|---|
| LysN MShigh |
|
|---|
| TryLysC MShigh |
|
|---|
General Statistics
Number of major isoforms |
Number of additional isoforms |
Number of all proteins |
Number of amino acids |
Min. Seq. Length |
Max. Seq. Length |
Avg. Seq. Length |
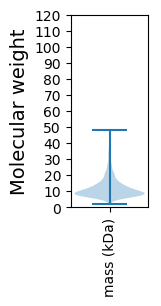
Avg. Mol. Weight |
|---|---|---|---|---|---|---|---|
0 |
93895 |
19 |
440 |
111.1 |
12.26 |
Amino acid frequency
Ala |
Cys |
Asp |
Glu |
Phe |
Gly |
His |
Ile |
Lys |
Leu |
|---|---|---|---|---|---|---|---|---|---|
9.235 ± 0.129 | 1.631 ± 0.043 |
6.44 ± 0.126 | 5.949 ± 0.131 |
2.575 ± 0.06 | 7.378 ± 0.111 |
2.309 ± 0.048 | 3.597 ± 0.087 |
1.913 ± 0.068 | 7.449 ± 0.094 |
Met |
Asn |
Gln |
Pro |
Arg |
Ser |
Thr |
Val |
Trp |
Tyr |
|---|---|---|---|---|---|---|---|---|---|
2.004 ± 0.045 | 2.388 ± 0.06 |
5.54 ± 0.095 | 2.693 ± 0.062 |
11.541 ± 0.158 | 8.967 ± 0.131 |
7.513 ± 0.11 | 7.743 ± 0.103 |
1.159 ± 0.039 | 1.977 ± 0.053 |
Most of the basic statistics you can see at this page can be downloaded from this CSV file
See this proteome in:

Proteome-pI is available under Creative Commons Attribution-NoDerivs license, for more details see here
| Reference: Kozlowski LP. Proteome-pI 2.0: Proteome Isoelectric Point Database Update. Nucleic Acids Res. 2021, doi: 10.1093/nar/gkab944 | Contact: Lukasz P. Kozlowski |