Eimeria necatrix
Taxonomy: cellular organisms; Eukaryota; Sar; Alveolata; Apicomplexa; Conoidasida; Coccidia; Eucoccidiorida; Eimeriorina; Eimeriidae; Eimeria
Average proteome isoelectric point is 7.08
Get precalculated fractions of proteins
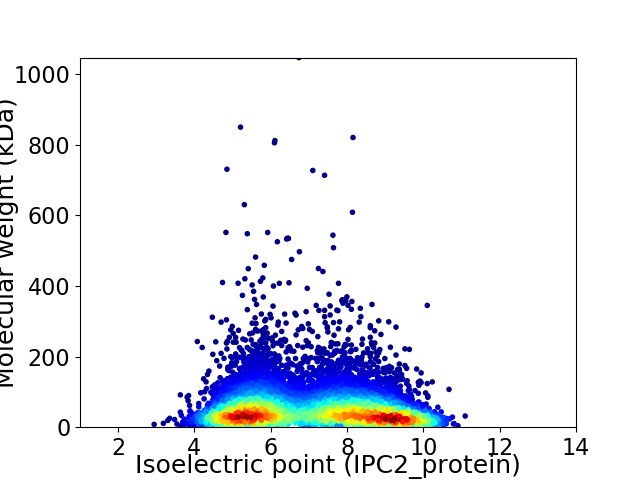
Virtual 2D-PAGE plot for 8608 proteins (isoelectric point calculated using IPC2_protein)
Get csv file with sequences according to given criteria:
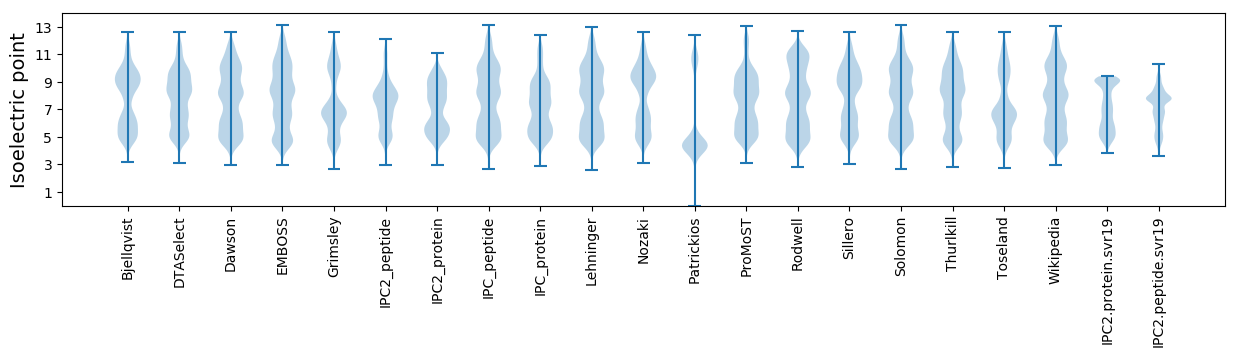
* You can choose from 21 different methods for calculating isoelectric point
Summary statistics related to proteome-wise predictions
Protein with the lowest isoelectric point:
>tr|U6MDL0|U6MDL0_9EIME Uncharacterized protein OS=Eimeria necatrix OX=51315 GN=ENH_00004120 PE=4 SV=1
MM1 pKa = 7.01FQYY4 pKa = 10.91SSAAAADD11 pKa = 3.74PAAAAAAADD20 pKa = 4.07PAAAAADD27 pKa = 3.88PAAAAAAAAAAAAGPPLCSTSAVFMLSMLLFKK59 pKa = 10.14TQLQALLGVNSPASLQQQAAFAAAGNSSS87 pKa = 3.09
MM1 pKa = 7.01FQYY4 pKa = 10.91SSAAAADD11 pKa = 3.74PAAAAAAADD20 pKa = 4.07PAAAAADD27 pKa = 3.88PAAAAAAAAAAAAGPPLCSTSAVFMLSMLLFKK59 pKa = 10.14TQLQALLGVNSPASLQQQAAFAAAGNSSS87 pKa = 3.09
Molecular weight: 8.14 kDa
Isoelectric point according different methods:
Protein with the highest isoelectric point:
>tr|U6MUE7|U6MUE7_9EIME Uncharacterized protein OS=Eimeria necatrix OX=51315 GN=ENH_00013950 PE=4 SV=1
MM1 pKa = 7.47LNSKK5 pKa = 10.61LKK7 pKa = 9.12MPAIRR12 pKa = 11.84RR13 pKa = 11.84IMPIPKK19 pKa = 9.49SKK21 pKa = 10.67RR22 pKa = 11.84STFVAKK28 pKa = 10.43RR29 pKa = 11.84PRR31 pKa = 11.84LFLKK35 pKa = 10.69
MM1 pKa = 7.47LNSKK5 pKa = 10.61LKK7 pKa = 9.12MPAIRR12 pKa = 11.84RR13 pKa = 11.84IMPIPKK19 pKa = 9.49SKK21 pKa = 10.67RR22 pKa = 11.84STFVAKK28 pKa = 10.43RR29 pKa = 11.84PRR31 pKa = 11.84LFLKK35 pKa = 10.69
Molecular weight: 4.15 kDa
Isoelectric point according different methods:
Peptides (in silico digests for buttom-up proteomics)
Below you can find in silico digests of the whole proteome with Trypsin, Chymotrypsin, Trypsin+LysC, LysN, ArgC proteases suitable for different mass spec machines.| Try ESI |
 |
|---|
| ChTry ESI |
|
|---|
| ArgC ESI |
|
|---|
| LysN ESI |
|
|---|
| TryLysC ESI |
|
|---|
| Try MALDI |
|
|---|
| ChTry MALDI |
|
|---|
| ArgC MALDI |
|
|---|
| LysN MALDI |
|
|---|
| TryLysC MALDI |
|
|---|
| Try LTQ |
|
|---|
| ChTry LTQ |
|
|---|
| ArgC LTQ |
|
|---|
| LysN LTQ |
|
|---|
| TryLysC LTQ |
|
|---|
| Try MSlow |
|
|---|
| ChTry MSlow |
|
|---|
| ArgC MSlow |
|
|---|
| LysN MSlow |
|
|---|
| TryLysC MSlow |
|
|---|
| Try MShigh |
|
|---|
| ChTry MShigh |
|
|---|
| ArgC MShigh |
|
|---|
| LysN MShigh |
|
|---|
| TryLysC MShigh |
|
|---|
General Statistics
Number of major isoforms |
Number of additional isoforms |
Number of all proteins |
Number of amino acids |
Min. Seq. Length |
Max. Seq. Length |
Avg. Seq. Length |
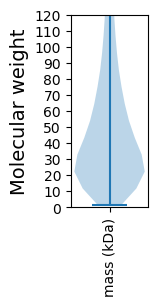
Avg. Mol. Weight |
|---|---|---|---|---|---|---|---|
0 |
4723510 |
9 |
9857 |
548.7 |
58.53 |
Amino acid frequency
Ala |
Cys |
Asp |
Glu |
Phe |
Gly |
His |
Ile |
Lys |
Leu |
|---|---|---|---|---|---|---|---|---|---|
15.897 ± 0.097 | 2.027 ± 0.018 |
3.376 ± 0.018 | 5.817 ± 0.026 |
2.619 ± 0.017 | 6.481 ± 0.035 |
1.968 ± 0.012 | 2.227 ± 0.017 |
3.541 ± 0.023 | 9.784 ± 0.044 |
Met |
Asn |
Gln |
Pro |
Arg |
Ser |
Thr |
Val |
Trp |
Tyr |
|---|---|---|---|---|---|---|---|---|---|
1.275 ± 0.009 | 2.055 ± 0.014 |
6.229 ± 0.035 | 10.095 ± 0.097 |
5.963 ± 0.023 | 9.536 ± 0.046 |
4.078 ± 0.021 | 4.648 ± 0.026 |
0.995 ± 0.008 | 1.39 ± 0.01 |
Most of the basic statistics you can see at this page can be downloaded from this CSV file
See this proteome in:

Proteome-pI is available under Creative Commons Attribution-NoDerivs license, for more details see here
| Reference: Kozlowski LP. Proteome-pI 2.0: Proteome Isoelectric Point Database Update. Nucleic Acids Res. 2021, doi: 10.1093/nar/gkab944 | Contact: Lukasz P. Kozlowski |