Sporosarcina phage Lietuvens
Taxonomy: Viruses; Duplodnaviria; Heunggongvirae; Uroviricota; Caudoviricetes; Caudovirales; Myoviridae; unclassified Myoviridae
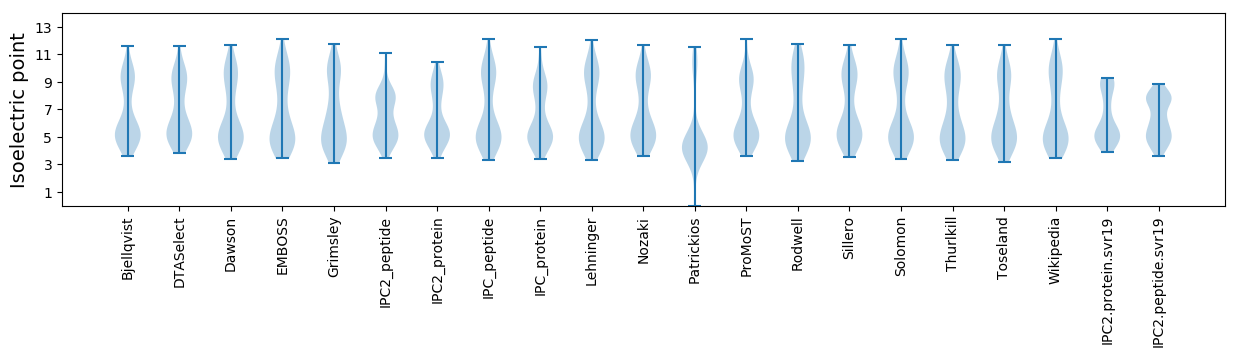
Average proteome isoelectric point is 6.36
Get precalculated fractions of proteins
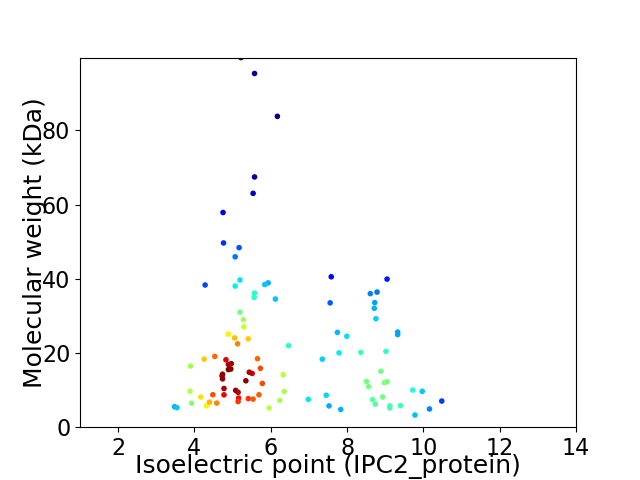
Virtual 2D-PAGE plot for 100 proteins (isoelectric point calculated using IPC2_protein)
Get csv file with sequences according to given criteria:
* You can choose from 21 different methods for calculating isoelectric point
Summary statistics related to proteome-wise predictions
Protein with the lowest isoelectric point:
>tr|A0A6G6XUT8|A0A6G6XUT8_9CAUD Uncharacterized protein OS=Sporosarcina phage Lietuvens OX=2713145 PE=4 SV=1
MM1 pKa = 7.4TCNEE5 pKa = 4.42CNADD9 pKa = 4.07LNAADD14 pKa = 4.16PHH16 pKa = 6.17TDD18 pKa = 2.81ATYY21 pKa = 10.97DD22 pKa = 3.38DD23 pKa = 4.54HH24 pKa = 8.15AQVYY28 pKa = 8.85YY29 pKa = 11.01CDD31 pKa = 3.82VDD33 pKa = 4.6CFRR36 pKa = 11.84AWADD40 pKa = 3.24GHH42 pKa = 6.08FDD44 pKa = 3.5EE45 pKa = 5.12VTAYY49 pKa = 9.18YY50 pKa = 11.01EE51 pKa = 4.08RR52 pKa = 11.84MNVQQ56 pKa = 2.89
MM1 pKa = 7.4TCNEE5 pKa = 4.42CNADD9 pKa = 4.07LNAADD14 pKa = 4.16PHH16 pKa = 6.17TDD18 pKa = 2.81ATYY21 pKa = 10.97DD22 pKa = 3.38DD23 pKa = 4.54HH24 pKa = 8.15AQVYY28 pKa = 8.85YY29 pKa = 11.01CDD31 pKa = 3.82VDD33 pKa = 4.6CFRR36 pKa = 11.84AWADD40 pKa = 3.24GHH42 pKa = 6.08FDD44 pKa = 3.5EE45 pKa = 5.12VTAYY49 pKa = 9.18YY50 pKa = 11.01EE51 pKa = 4.08RR52 pKa = 11.84MNVQQ56 pKa = 2.89
Molecular weight: 6.49 kDa
Isoelectric point according different methods:
Protein with the highest isoelectric point:
>tr|A0A6G6XVM5|A0A6G6XVM5_9CAUD Site-specific integrase OS=Sporosarcina phage Lietuvens OX=2713145 PE=3 SV=1
MM1 pKa = 7.23IVYY4 pKa = 9.28VYY6 pKa = 10.71RR7 pKa = 11.84LAFYY11 pKa = 10.67IEE13 pKa = 4.0IAGLNLSKK21 pKa = 10.38EE22 pKa = 4.34RR23 pKa = 11.84KK24 pKa = 7.84ATRR27 pKa = 11.84QKK29 pKa = 10.89KK30 pKa = 8.5EE31 pKa = 3.79RR32 pKa = 11.84QPAPRR37 pKa = 11.84RR38 pKa = 11.84RR39 pKa = 11.84YY40 pKa = 9.34
MM1 pKa = 7.23IVYY4 pKa = 9.28VYY6 pKa = 10.71RR7 pKa = 11.84LAFYY11 pKa = 10.67IEE13 pKa = 4.0IAGLNLSKK21 pKa = 10.38EE22 pKa = 4.34RR23 pKa = 11.84KK24 pKa = 7.84ATRR27 pKa = 11.84QKK29 pKa = 10.89KK30 pKa = 8.5EE31 pKa = 3.79RR32 pKa = 11.84QPAPRR37 pKa = 11.84RR38 pKa = 11.84RR39 pKa = 11.84YY40 pKa = 9.34
Molecular weight: 4.91 kDa
Isoelectric point according different methods:
Peptides (in silico digests for buttom-up proteomics)
Below you can find in silico digests of the whole proteome with Trypsin, Chymotrypsin, Trypsin+LysC, LysN, ArgC proteases suitable for different mass spec machines.| Try ESI |
 |
|---|
| ChTry ESI |
|
|---|
| ArgC ESI |
|
|---|
| LysN ESI |
|
|---|
| TryLysC ESI |
|
|---|
| Try MALDI |
|
|---|
| ChTry MALDI |
|
|---|
| ArgC MALDI |
|
|---|
| LysN MALDI |
|
|---|
| TryLysC MALDI |
|
|---|
| Try LTQ |
|
|---|
| ChTry LTQ |
|
|---|
| ArgC LTQ |
|
|---|
| LysN LTQ |
|
|---|
| TryLysC LTQ |
|
|---|
| Try MSlow |
|
|---|
| ChTry MSlow |
|
|---|
| ArgC MSlow |
|
|---|
| LysN MSlow |
|
|---|
| TryLysC MSlow |
|
|---|
| Try MShigh |
|
|---|
| ChTry MShigh |
|
|---|
| ArgC MShigh |
|
|---|
| LysN MShigh |
|
|---|
| TryLysC MShigh |
|
|---|
General Statistics
Number of major isoforms |
Number of additional isoforms |
Number of all proteins |
Number of amino acids |
Min. Seq. Length |
Max. Seq. Length |
Avg. Seq. Length |
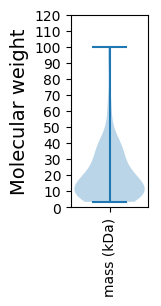
Avg. Mol. Weight |
|---|---|---|---|---|---|---|---|
0 |
19522 |
30 |
914 |
195.2 |
21.82 |
Amino acid frequency
Ala |
Cys |
Asp |
Glu |
Phe |
Gly |
His |
Ile |
Lys |
Leu |
|---|---|---|---|---|---|---|---|---|---|
9.241 ± 0.426 | 0.85 ± 0.138 |
6.628 ± 0.221 | 7.228 ± 0.32 |
3.611 ± 0.185 | 7.064 ± 0.312 |
1.834 ± 0.107 | 5.983 ± 0.201 |
6.787 ± 0.244 | 7.812 ± 0.216 |
Met |
Asn |
Gln |
Pro |
Arg |
Ser |
Thr |
Val |
Trp |
Tyr |
|---|---|---|---|---|---|---|---|---|---|
2.418 ± 0.151 | 4.211 ± 0.225 |
3.237 ± 0.153 | 2.848 ± 0.149 |
5.855 ± 0.28 | 5.793 ± 0.192 |
6.342 ± 0.204 | 7.079 ± 0.23 |
1.101 ± 0.084 | 4.077 ± 0.162 |
Most of the basic statistics you can see at this page can be downloaded from this CSV file
See this proteome in:

Proteome-pI is available under Creative Commons Attribution-NoDerivs license, for more details see here
| Reference: Kozlowski LP. Proteome-pI 2.0: Proteome Isoelectric Point Database Update. Nucleic Acids Res. 2021, doi: 10.1093/nar/gkab944 | Contact: Lukasz P. Kozlowski |