Spiroplasma virus SpV1-C74 (SpV1)
Taxonomy: Viruses; Monodnaviria; Loebvirae; Hofneiviricota; Faserviricetes; Tubulavirales; Plectroviridae; Vespertiliovirus; Spiroplasma virus C74
Average proteome isoelectric point is 8.18
Get precalculated fractions of proteins
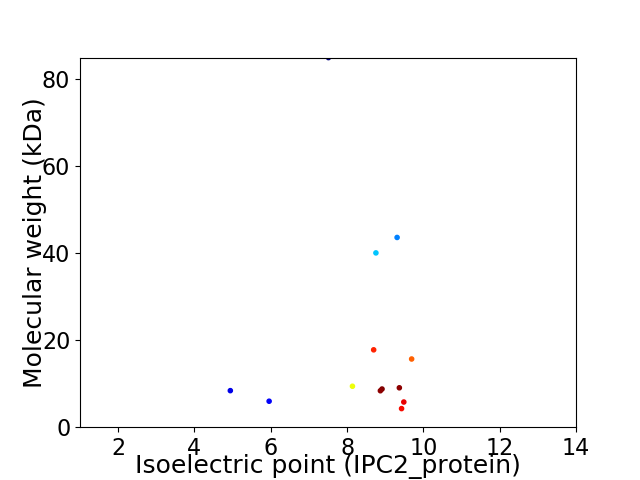
Virtual 2D-PAGE plot for 13 proteins (isoelectric point calculated using IPC2_protein)
Get csv file with sequences according to given criteria:
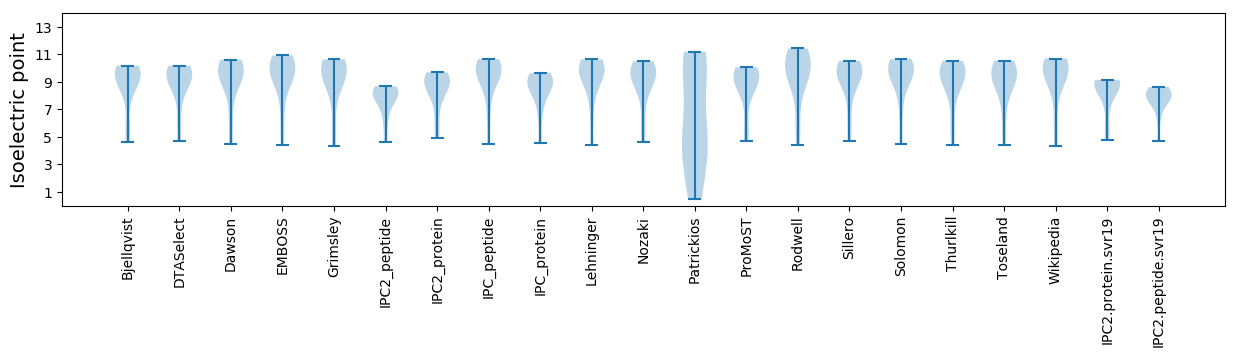
* You can choose from 21 different methods for calculating isoelectric point
Summary statistics related to proteome-wise predictions
Protein with the lowest isoelectric point:
>sp|Q88427|ORF2_SPV1C Uncharacterized protein ORF2 OS=Spiroplasma virus SpV1-C74 OX=185959 GN=ORF2 PE=3 SV=1
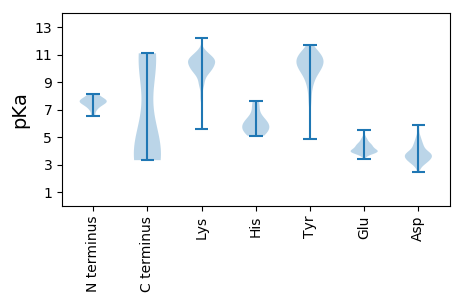
MM1 pKa = 7.09QNDD4 pKa = 3.16WQEE7 pKa = 3.94FKK9 pKa = 11.24EE10 pKa = 3.91FFIYY14 pKa = 10.26IFLFIDD20 pKa = 3.43KK21 pKa = 10.52ANVEE25 pKa = 4.75SIIMWNLTQNEE36 pKa = 4.89YY37 pKa = 9.22LTLMVGVWVVILFLTWFFLWMVFKK61 pKa = 10.77IVGYY65 pKa = 9.59FKK67 pKa = 11.09
MM1 pKa = 7.09QNDD4 pKa = 3.16WQEE7 pKa = 3.94FKK9 pKa = 11.24EE10 pKa = 3.91FFIYY14 pKa = 10.26IFLFIDD20 pKa = 3.43KK21 pKa = 10.52ANVEE25 pKa = 4.75SIIMWNLTQNEE36 pKa = 4.89YY37 pKa = 9.22LTLMVGVWVVILFLTWFFLWMVFKK61 pKa = 10.77IVGYY65 pKa = 9.59FKK67 pKa = 11.09
Molecular weight: 8.39 kDa
Isoelectric point according different methods:
Protein with the highest isoelectric point:
>sp|Q88417|ORF15_SPV1C Uncharacterized protein ORF15 OS=Spiroplasma virus SpV1-C74 OX=185959 GN=ORF15 PE=4 SV=1
MM1 pKa = 7.51VKK3 pKa = 9.98MINLLVVEE11 pKa = 4.84NNNSNWDD18 pKa = 3.76KK19 pKa = 10.97IFSFVFDD26 pKa = 3.42IFLFIFDD33 pKa = 4.91VIWNTKK39 pKa = 10.34LPMTNTSIAYY49 pKa = 8.33FLVFFMVIKK58 pKa = 10.42LSIYY62 pKa = 9.85AIHH65 pKa = 6.33GTSTQYY71 pKa = 11.67NNLGSTVNNGVSQVYY86 pKa = 10.36SSTVRR91 pKa = 11.84KK92 pKa = 9.62GINVGKK98 pKa = 10.05NVYY101 pKa = 10.03QNSNKK106 pKa = 9.42QQVKK110 pKa = 10.36KK111 pKa = 9.78EE112 pKa = 4.23LKK114 pKa = 8.82RR115 pKa = 11.84QSIRR119 pKa = 11.84YY120 pKa = 5.3QAKK123 pKa = 9.81NIRR126 pKa = 11.84STKK129 pKa = 10.22FKK131 pKa = 10.76GDD133 pKa = 3.12KK134 pKa = 10.15KK135 pKa = 10.98
MM1 pKa = 7.51VKK3 pKa = 9.98MINLLVVEE11 pKa = 4.84NNNSNWDD18 pKa = 3.76KK19 pKa = 10.97IFSFVFDD26 pKa = 3.42IFLFIFDD33 pKa = 4.91VIWNTKK39 pKa = 10.34LPMTNTSIAYY49 pKa = 8.33FLVFFMVIKK58 pKa = 10.42LSIYY62 pKa = 9.85AIHH65 pKa = 6.33GTSTQYY71 pKa = 11.67NNLGSTVNNGVSQVYY86 pKa = 10.36SSTVRR91 pKa = 11.84KK92 pKa = 9.62GINVGKK98 pKa = 10.05NVYY101 pKa = 10.03QNSNKK106 pKa = 9.42QQVKK110 pKa = 10.36KK111 pKa = 9.78EE112 pKa = 4.23LKK114 pKa = 8.82RR115 pKa = 11.84QSIRR119 pKa = 11.84YY120 pKa = 5.3QAKK123 pKa = 9.81NIRR126 pKa = 11.84STKK129 pKa = 10.22FKK131 pKa = 10.76GDD133 pKa = 3.12KK134 pKa = 10.15KK135 pKa = 10.98
Molecular weight: 15.65 kDa
Isoelectric point according different methods:
Peptides (in silico digests for buttom-up proteomics)
Below you can find in silico digests of the whole proteome with Trypsin, Chymotrypsin, Trypsin+LysC, LysN, ArgC proteases suitable for different mass spec machines.| Try ESI |
 |
|---|
| ChTry ESI |
|
|---|
| ArgC ESI |
|
|---|
| LysN ESI |
|
|---|
| TryLysC ESI |
|
|---|
| Try MALDI |
|
|---|
| ChTry MALDI |
|
|---|
| ArgC MALDI |
|
|---|
| LysN MALDI |
|
|---|
| TryLysC MALDI |
|
|---|
| Try LTQ |
|
|---|
| ChTry LTQ |
|
|---|
| ArgC LTQ |
|
|---|
| LysN LTQ |
|
|---|
| TryLysC LTQ |
|
|---|
| Try MSlow |
|
|---|
| ChTry MSlow |
|
|---|
| ArgC MSlow |
|
|---|
| LysN MSlow |
|
|---|
| TryLysC MSlow |
|
|---|
| Try MShigh |
|
|---|
| ChTry MShigh |
|
|---|
| ArgC MShigh |
|
|---|
| LysN MShigh |
|
|---|
| TryLysC MShigh |
|
|---|
General Statistics
Number of major isoforms |
Number of additional isoforms |
Number of all proteins |
Number of amino acids |
Min. Seq. Length |
Max. Seq. Length |
Avg. Seq. Length |
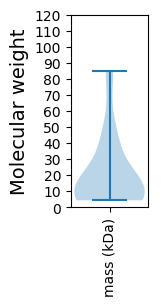
Avg. Mol. Weight |
|---|---|---|---|---|---|---|---|
0 |
2197 |
36 |
713 |
169.0 |
20.13 |
Amino acid frequency
Ala |
Cys |
Asp |
Glu |
Phe |
Gly |
His |
Ile |
Lys |
Leu |
|---|---|---|---|---|---|---|---|---|---|
2.868 ± 0.301 | 0.546 ± 0.257 |
4.461 ± 0.651 | 4.324 ± 0.481 |
8.739 ± 0.509 | 4.188 ± 0.379 |
0.91 ± 0.211 | 9.422 ± 0.875 |
10.332 ± 1.022 | 9.968 ± 0.72 |
Met |
Asn |
Gln |
Pro |
Arg |
Ser |
Thr |
Val |
Trp |
Tyr |
|---|---|---|---|---|---|---|---|---|---|
2.185 ± 0.499 | 8.557 ± 1.233 |
2.094 ± 0.257 | 3.459 ± 0.515 |
2.822 ± 0.345 | 5.872 ± 0.449 |
4.506 ± 0.419 | 5.963 ± 0.568 |
2.594 ± 0.443 | 6.19 ± 0.662 |
Most of the basic statistics you can see at this page can be downloaded from this CSV file
See this proteome in:

Proteome-pI is available under Creative Commons Attribution-NoDerivs license, for more details see here
| Reference: Kozlowski LP. Proteome-pI 2.0: Proteome Isoelectric Point Database Update. Nucleic Acids Res. 2021, doi: 10.1093/nar/gkab944 | Contact: Lukasz P. Kozlowski |