Micromonospora narathiwatensis
Taxonomy: cellular organisms; Bacteria; Terrabacteria group; Actinobacteria; Actinomycetia; Micromonosporales; Micromonosporaceae; Micromonospora
Average proteome isoelectric point is 6.7
Get precalculated fractions of proteins
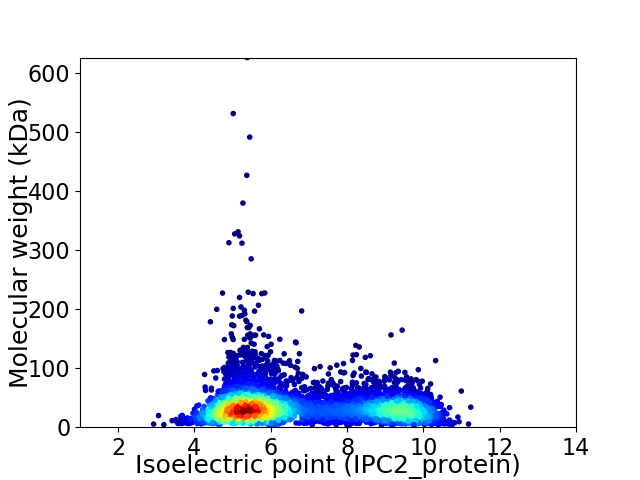
Virtual 2D-PAGE plot for 5762 proteins (isoelectric point calculated using IPC2_protein)
Get csv file with sequences according to given criteria:
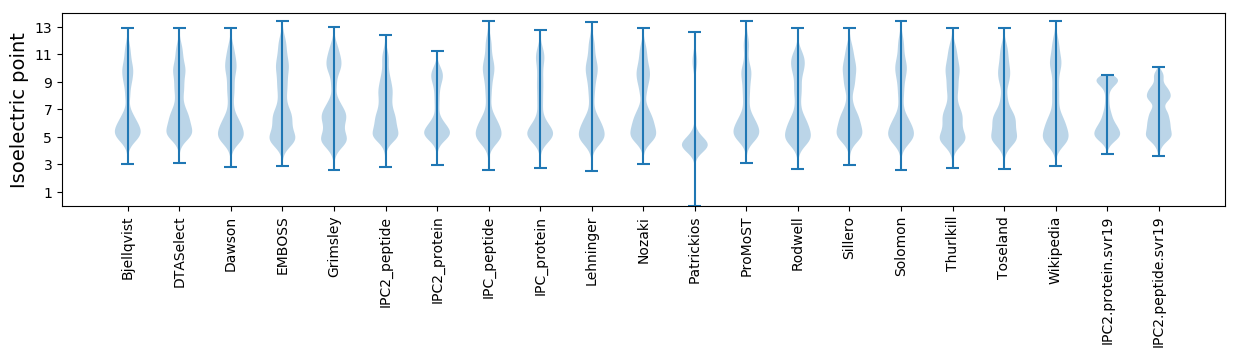
* You can choose from 21 different methods for calculating isoelectric point
Summary statistics related to proteome-wise predictions
Protein with the lowest isoelectric point:
>tr|A0A1A9ACK7|A0A1A9ACK7_9ACTN Threonine dehydratase OS=Micromonospora narathiwatensis OX=299146 GN=GA0070621_5019 PE=4 SV=1
MM1 pKa = 6.64VTTMYY6 pKa = 10.11QVQGMTCGHH15 pKa = 6.59CVNSVNAEE23 pKa = 3.72VGAIPGVSDD32 pKa = 3.61VQVDD36 pKa = 4.18LASGRR41 pKa = 11.84VTVTSEE47 pKa = 4.19SPLDD51 pKa = 3.66TDD53 pKa = 3.8TVRR56 pKa = 11.84AAVDD60 pKa = 3.1EE61 pKa = 4.62AGYY64 pKa = 11.0DD65 pKa = 3.52LVGAA69 pKa = 4.97
MM1 pKa = 6.64VTTMYY6 pKa = 10.11QVQGMTCGHH15 pKa = 6.59CVNSVNAEE23 pKa = 3.72VGAIPGVSDD32 pKa = 3.61VQVDD36 pKa = 4.18LASGRR41 pKa = 11.84VTVTSEE47 pKa = 4.19SPLDD51 pKa = 3.66TDD53 pKa = 3.8TVRR56 pKa = 11.84AAVDD60 pKa = 3.1EE61 pKa = 4.62AGYY64 pKa = 11.0DD65 pKa = 3.52LVGAA69 pKa = 4.97
Molecular weight: 7.06 kDa
Isoelectric point according different methods:
Protein with the highest isoelectric point:
>tr|A0A1A8ZYG8|A0A1A8ZYG8_9ACTN Predicted arabinose efflux permease MFS family OS=Micromonospora narathiwatensis OX=299146 GN=GA0070621_3295 PE=4 SV=1
MM1 pKa = 7.91AEE3 pKa = 4.14AQQATTRR10 pKa = 11.84PAAAPRR16 pKa = 11.84TRR18 pKa = 11.84KK19 pKa = 7.83QTSAARR25 pKa = 11.84RR26 pKa = 11.84ITGAAGTTTVTKK38 pKa = 10.59ASPNASGAGAGRR50 pKa = 11.84VPATKK55 pKa = 10.3AVAKK59 pKa = 10.08KK60 pKa = 9.72AAAKK64 pKa = 10.03KK65 pKa = 9.75VVSAARR71 pKa = 11.84KK72 pKa = 9.25APAKK76 pKa = 9.92AAPATKK82 pKa = 8.32TTAKK86 pKa = 10.12RR87 pKa = 11.84APATRR92 pKa = 11.84ATAKK96 pKa = 10.16KK97 pKa = 10.5APATAKK103 pKa = 10.21KK104 pKa = 10.56APATKK109 pKa = 9.25ATAKK113 pKa = 9.11KK114 pKa = 6.69TTAKK118 pKa = 9.81QAAAGRR124 pKa = 11.84TTAAAKK130 pKa = 9.41KK131 pKa = 10.22APAKK135 pKa = 7.31TTAAKK140 pKa = 9.92KK141 pKa = 10.18APARR145 pKa = 11.84KK146 pKa = 5.82TTAAATGAPAKK157 pKa = 9.45RR158 pKa = 11.84TTTAAAKK165 pKa = 9.25KK166 pKa = 9.97APARR170 pKa = 11.84ATAAARR176 pKa = 11.84KK177 pKa = 7.71ATSTTTKK184 pKa = 9.43ATAAAKK190 pKa = 10.28KK191 pKa = 10.37AGTAAKK197 pKa = 9.78KK198 pKa = 10.04AAAKK202 pKa = 6.76TTTKK206 pKa = 10.37RR207 pKa = 11.84APAKK211 pKa = 9.21RR212 pKa = 11.84TTAAAKK218 pKa = 9.35KK219 pKa = 10.38APAAKK224 pKa = 9.86KK225 pKa = 10.41APAKK229 pKa = 9.31KK230 pKa = 6.73TTAAAKK236 pKa = 7.44TAPAKK241 pKa = 9.47KK242 pKa = 6.79TTAAKK247 pKa = 9.96KK248 pKa = 10.45APAKK252 pKa = 10.32KK253 pKa = 9.09ATAVKK258 pKa = 10.3AAGTRR263 pKa = 11.84PAGGARR269 pKa = 11.84KK270 pKa = 8.75AAAKK274 pKa = 9.28KK275 pKa = 10.11APARR279 pKa = 11.84KK280 pKa = 6.22TTATSSTAARR290 pKa = 11.84KK291 pKa = 8.84AAGGRR296 pKa = 11.84KK297 pKa = 7.88ATSAASGVSAIEE309 pKa = 4.09ARR311 pKa = 11.84TSTSTGTHH319 pKa = 5.61KK320 pKa = 10.95RR321 pKa = 11.84LTAARR326 pKa = 11.84KK327 pKa = 7.84PAGTRR332 pKa = 11.84VVAGRR337 pKa = 11.84STAKK341 pKa = 10.08PGSARR346 pKa = 11.84RR347 pKa = 11.84ATGG350 pKa = 2.87
MM1 pKa = 7.91AEE3 pKa = 4.14AQQATTRR10 pKa = 11.84PAAAPRR16 pKa = 11.84TRR18 pKa = 11.84KK19 pKa = 7.83QTSAARR25 pKa = 11.84RR26 pKa = 11.84ITGAAGTTTVTKK38 pKa = 10.59ASPNASGAGAGRR50 pKa = 11.84VPATKK55 pKa = 10.3AVAKK59 pKa = 10.08KK60 pKa = 9.72AAAKK64 pKa = 10.03KK65 pKa = 9.75VVSAARR71 pKa = 11.84KK72 pKa = 9.25APAKK76 pKa = 9.92AAPATKK82 pKa = 8.32TTAKK86 pKa = 10.12RR87 pKa = 11.84APATRR92 pKa = 11.84ATAKK96 pKa = 10.16KK97 pKa = 10.5APATAKK103 pKa = 10.21KK104 pKa = 10.56APATKK109 pKa = 9.25ATAKK113 pKa = 9.11KK114 pKa = 6.69TTAKK118 pKa = 9.81QAAAGRR124 pKa = 11.84TTAAAKK130 pKa = 9.41KK131 pKa = 10.22APAKK135 pKa = 7.31TTAAKK140 pKa = 9.92KK141 pKa = 10.18APARR145 pKa = 11.84KK146 pKa = 5.82TTAAATGAPAKK157 pKa = 9.45RR158 pKa = 11.84TTTAAAKK165 pKa = 9.25KK166 pKa = 9.97APARR170 pKa = 11.84ATAAARR176 pKa = 11.84KK177 pKa = 7.71ATSTTTKK184 pKa = 9.43ATAAAKK190 pKa = 10.28KK191 pKa = 10.37AGTAAKK197 pKa = 9.78KK198 pKa = 10.04AAAKK202 pKa = 6.76TTTKK206 pKa = 10.37RR207 pKa = 11.84APAKK211 pKa = 9.21RR212 pKa = 11.84TTAAAKK218 pKa = 9.35KK219 pKa = 10.38APAAKK224 pKa = 9.86KK225 pKa = 10.41APAKK229 pKa = 9.31KK230 pKa = 6.73TTAAAKK236 pKa = 7.44TAPAKK241 pKa = 9.47KK242 pKa = 6.79TTAAKK247 pKa = 9.96KK248 pKa = 10.45APAKK252 pKa = 10.32KK253 pKa = 9.09ATAVKK258 pKa = 10.3AAGTRR263 pKa = 11.84PAGGARR269 pKa = 11.84KK270 pKa = 8.75AAAKK274 pKa = 9.28KK275 pKa = 10.11APARR279 pKa = 11.84KK280 pKa = 6.22TTATSSTAARR290 pKa = 11.84KK291 pKa = 8.84AAGGRR296 pKa = 11.84KK297 pKa = 7.88ATSAASGVSAIEE309 pKa = 4.09ARR311 pKa = 11.84TSTSTGTHH319 pKa = 5.61KK320 pKa = 10.95RR321 pKa = 11.84LTAARR326 pKa = 11.84KK327 pKa = 7.84PAGTRR332 pKa = 11.84VVAGRR337 pKa = 11.84STAKK341 pKa = 10.08PGSARR346 pKa = 11.84RR347 pKa = 11.84ATGG350 pKa = 2.87
Molecular weight: 33.99 kDa
Isoelectric point according different methods:
Peptides (in silico digests for buttom-up proteomics)
Below you can find in silico digests of the whole proteome with Trypsin, Chymotrypsin, Trypsin+LysC, LysN, ArgC proteases suitable for different mass spec machines.| Try ESI |
 |
|---|
| ChTry ESI |
|
|---|
| ArgC ESI |
|
|---|
| LysN ESI |
|
|---|
| TryLysC ESI |
|
|---|
| Try MALDI |
|
|---|
| ChTry MALDI |
|
|---|
| ArgC MALDI |
|
|---|
| LysN MALDI |
|
|---|
| TryLysC MALDI |
|
|---|
| Try LTQ |
|
|---|
| ChTry LTQ |
|
|---|
| ArgC LTQ |
|
|---|
| LysN LTQ |
|
|---|
| TryLysC LTQ |
|
|---|
| Try MSlow |
|
|---|
| ChTry MSlow |
|
|---|
| ArgC MSlow |
|
|---|
| LysN MSlow |
|
|---|
| TryLysC MSlow |
|
|---|
| Try MShigh |
|
|---|
| ChTry MShigh |
|
|---|
| ArgC MShigh |
|
|---|
| LysN MShigh |
|
|---|
| TryLysC MShigh |
|
|---|
General Statistics
Number of major isoforms |
Number of additional isoforms |
Number of all proteins |
Number of amino acids |
Min. Seq. Length |
Max. Seq. Length |
Avg. Seq. Length |
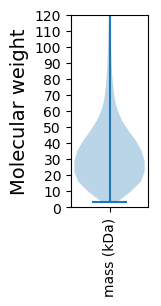
Avg. Mol. Weight |
|---|---|---|---|---|---|---|---|
0 |
1962101 |
31 |
5911 |
340.5 |
36.39 |
Amino acid frequency
Ala |
Cys |
Asp |
Glu |
Phe |
Gly |
His |
Ile |
Lys |
Leu |
|---|---|---|---|---|---|---|---|---|---|
14.137 ± 0.047 | 0.748 ± 0.008 |
5.976 ± 0.027 | 5.037 ± 0.032 |
2.616 ± 0.018 | 9.428 ± 0.03 |
2.113 ± 0.022 | 3.076 ± 0.022 |
1.669 ± 0.025 | 10.582 ± 0.048 |
Met |
Asn |
Gln |
Pro |
Arg |
Ser |
Thr |
Val |
Trp |
Tyr |
|---|---|---|---|---|---|---|---|---|---|
1.557 ± 0.012 | 1.837 ± 0.023 |
6.502 ± 0.033 | 2.678 ± 0.018 |
8.58 ± 0.041 | 4.58 ± 0.025 |
6.13 ± 0.037 | 9.021 ± 0.034 |
1.613 ± 0.012 | 2.12 ± 0.018 |
Most of the basic statistics you can see at this page can be downloaded from this CSV file
See this proteome in:

Proteome-pI is available under Creative Commons Attribution-NoDerivs license, for more details see here
| Reference: Kozlowski LP. Proteome-pI 2.0: Proteome Isoelectric Point Database Update. Nucleic Acids Res. 2021, doi: 10.1093/nar/gkab944 | Contact: Lukasz P. Kozlowski |