Podoviridae sp. ctLUJ1
Taxonomy: Viruses; Duplodnaviria; Heunggongvirae; Uroviricota; Caudoviricetes; Caudovirales; Schitoviridae; unclassified Schitoviridae
Average proteome isoelectric point is 6.18
Get precalculated fractions of proteins
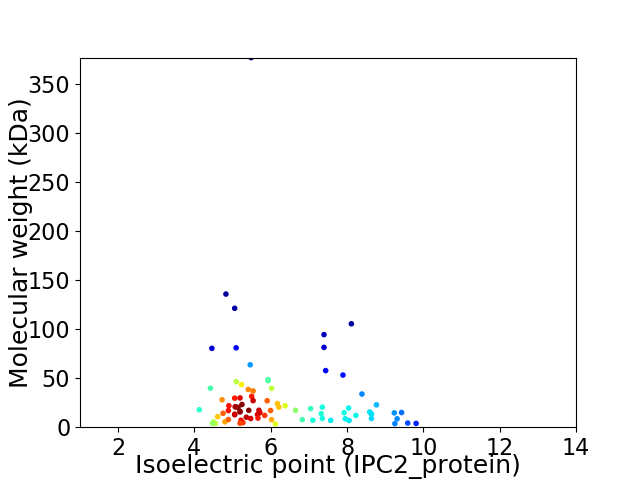
Virtual 2D-PAGE plot for 84 proteins (isoelectric point calculated using IPC2_protein)
Get csv file with sequences according to given criteria:
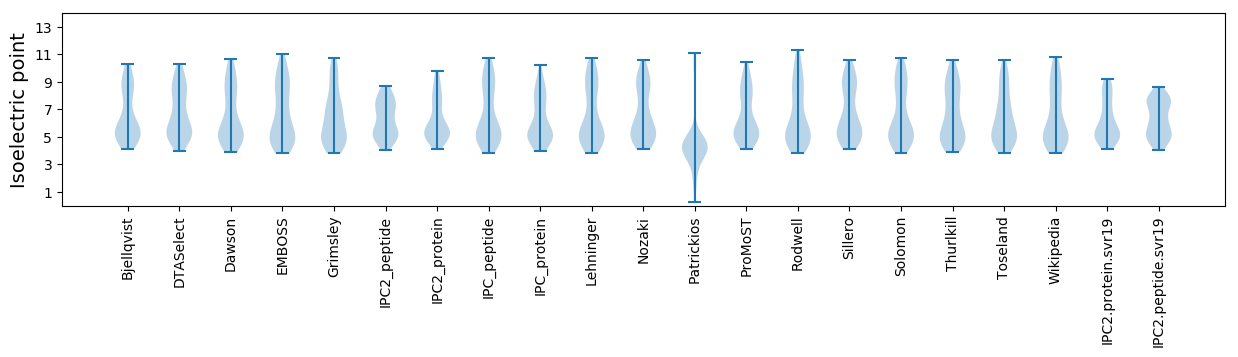
* You can choose from 21 different methods for calculating isoelectric point
Summary statistics related to proteome-wise predictions
Protein with the lowest isoelectric point:
>tr|A0A5Q2W8N1|A0A5Q2W8N1_9CAUD DNA-directed RNA polymerase subunit alpha OS=Podoviridae sp. ctLUJ1 OX=2656710 PE=4 SV=1
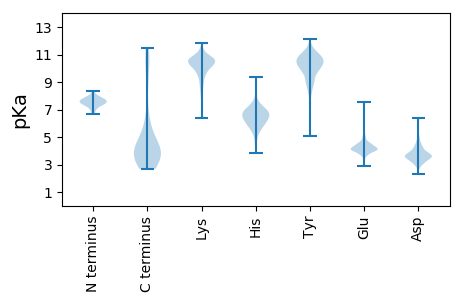
MM1 pKa = 7.77FYY3 pKa = 10.55TRR5 pKa = 11.84IEE7 pKa = 4.1FLPLNEE13 pKa = 4.19GEE15 pKa = 3.88IFYY18 pKa = 10.65FIMLFFWCFSSEE30 pKa = 4.06FF31 pKa = 3.7
MM1 pKa = 7.77FYY3 pKa = 10.55TRR5 pKa = 11.84IEE7 pKa = 4.1FLPLNEE13 pKa = 4.19GEE15 pKa = 3.88IFYY18 pKa = 10.65FIMLFFWCFSSEE30 pKa = 4.06FF31 pKa = 3.7
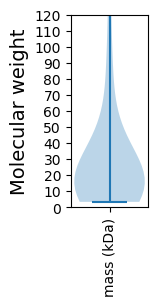
Molecular weight: 3.97 kDa
Isoelectric point according different methods:
Protein with the highest isoelectric point:
>tr|A0A5Q2W3M6|A0A5Q2W3M6_9CAUD Uncharacterized protein OS=Podoviridae sp. ctLUJ1 OX=2656710 PE=4 SV=1
MM1 pKa = 7.17VGSFFLPVSAARR13 pKa = 11.84SLRR16 pKa = 11.84AADD19 pKa = 3.51SAKK22 pKa = 10.61QKK24 pKa = 8.71GTKK27 pKa = 8.92EE28 pKa = 4.16KK29 pKa = 10.93YY30 pKa = 10.41LSDD33 pKa = 3.63SNKK36 pKa = 9.75PNRR39 pKa = 3.89
MM1 pKa = 7.17VGSFFLPVSAARR13 pKa = 11.84SLRR16 pKa = 11.84AADD19 pKa = 3.51SAKK22 pKa = 10.61QKK24 pKa = 8.71GTKK27 pKa = 8.92EE28 pKa = 4.16KK29 pKa = 10.93YY30 pKa = 10.41LSDD33 pKa = 3.63SNKK36 pKa = 9.75PNRR39 pKa = 3.89
Molecular weight: 4.26 kDa
Isoelectric point according different methods:
Peptides (in silico digests for buttom-up proteomics)
Below you can find in silico digests of the whole proteome with Trypsin, Chymotrypsin, Trypsin+LysC, LysN, ArgC proteases suitable for different mass spec machines.| Try ESI |
 |
|---|
| ChTry ESI |
|
|---|
| ArgC ESI |
|
|---|
| LysN ESI |
|
|---|
| TryLysC ESI |
|
|---|
| Try MALDI |
|
|---|
| ChTry MALDI |
|
|---|
| ArgC MALDI |
|
|---|
| LysN MALDI |
|
|---|
| TryLysC MALDI |
|
|---|
| Try LTQ |
|
|---|
| ChTry LTQ |
|
|---|
| ArgC LTQ |
|
|---|
| LysN LTQ |
|
|---|
| TryLysC LTQ |
|
|---|
| Try MSlow |
|
|---|
| ChTry MSlow |
|
|---|
| ArgC MSlow |
|
|---|
| LysN MSlow |
|
|---|
| TryLysC MSlow |
|
|---|
| Try MShigh |
|
|---|
| ChTry MShigh |
|
|---|
| ArgC MShigh |
|
|---|
| LysN MShigh |
|
|---|
| TryLysC MShigh |
|
|---|
General Statistics
Number of major isoforms |
Number of additional isoforms |
Number of all proteins |
Number of amino acids |
Min. Seq. Length |
Max. Seq. Length |
Avg. Seq. Length |
Avg. Mol. Weight |
|---|---|---|---|---|---|---|---|
0 |
22778 |
29 |
3446 |
271.2 |
30.19 |
Amino acid frequency
Ala |
Cys |
Asp |
Glu |
Phe |
Gly |
His |
Ile |
Lys |
Leu |
|---|---|---|---|---|---|---|---|---|---|
8.701 ± 0.638 | 0.922 ± 0.16 |
5.598 ± 0.124 | 6.765 ± 0.238 |
3.639 ± 0.196 | 5.778 ± 0.273 |
1.901 ± 0.124 | 6.528 ± 0.276 |
6.954 ± 0.27 | 8.93 ± 0.271 |
Met |
Asn |
Gln |
Pro |
Arg |
Ser |
Thr |
Val |
Trp |
Tyr |
|---|---|---|---|---|---|---|---|---|---|
2.586 ± 0.147 | 5.562 ± 0.133 |
3.749 ± 0.187 | 3.648 ± 0.238 |
3.898 ± 0.152 | 6.634 ± 0.332 |
6.818 ± 0.291 | 6.761 ± 0.16 |
1.005 ± 0.134 | 3.622 ± 0.22 |
Most of the basic statistics you can see at this page can be downloaded from this CSV file
See this proteome in:

Proteome-pI is available under Creative Commons Attribution-NoDerivs license, for more details see here
| Reference: Kozlowski LP. Proteome-pI 2.0: Proteome Isoelectric Point Database Update. Nucleic Acids Res. 2021, doi: 10.1093/nar/gkab944 | Contact: Lukasz P. Kozlowski |