Tibrogargan virus (strain CS132) (TIBV)
Taxonomy: Viruses; Riboviria; Orthornavirae; Negarnaviricota; Haploviricotina; Monjiviricetes; Mononegavirales; Rhabdoviridae; Alpharhabdovirinae; Tibrovirus; Tibrogargan tibrovirus; Tibrogargan virus
Average proteome isoelectric point is 6.97
Get precalculated fractions of proteins
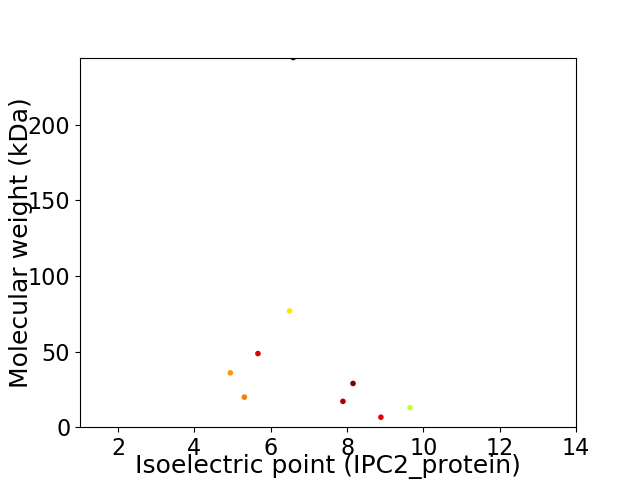
Virtual 2D-PAGE plot for 9 proteins (isoelectric point calculated using IPC2_protein)
Get csv file with sequences according to given criteria:
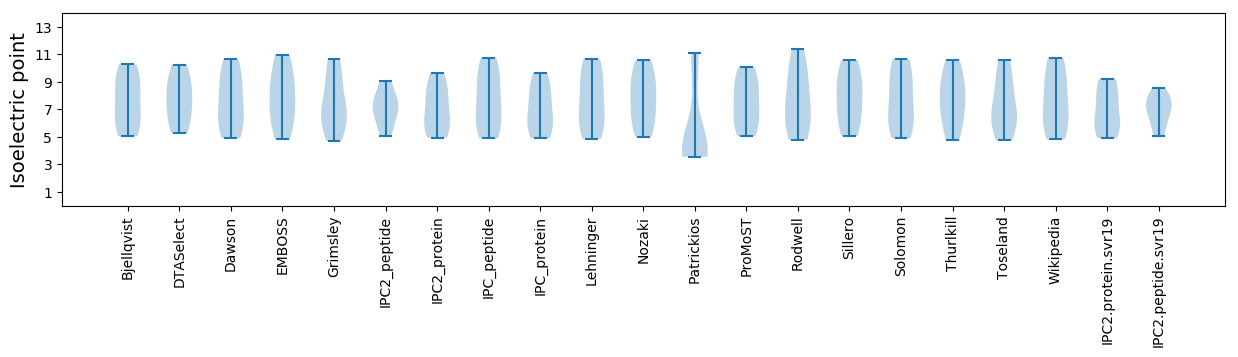
* You can choose from 21 different methods for calculating isoelectric point
Summary statistics related to proteome-wise predictions
Protein with the lowest isoelectric point:
>sp|D8V072|MATRX_TIBVC Matrix protein OS=Tibrogargan virus (strain CS132) OX=1559361 GN=M PE=3 SV=1
MM1 pKa = 7.18KK2 pKa = 9.89RR3 pKa = 11.84HH4 pKa = 6.68RR5 pKa = 11.84ISIPYY10 pKa = 8.38VTDD13 pKa = 3.12QVLRR17 pKa = 11.84NTSDD21 pKa = 3.44VVDD24 pKa = 4.58PNDD27 pKa = 4.1TVDD30 pKa = 4.27QLISDD35 pKa = 4.14DD36 pKa = 4.05VVNPKK41 pKa = 9.92QDD43 pKa = 3.31LKK45 pKa = 11.26EE46 pKa = 4.06FLDD49 pKa = 3.88SRR51 pKa = 11.84EE52 pKa = 3.88LNYY55 pKa = 9.44RR56 pKa = 11.84TRR58 pKa = 11.84ASLASSYY65 pKa = 11.65DD66 pKa = 3.48DD67 pKa = 5.93DD68 pKa = 4.99DD69 pKa = 4.0WADD72 pKa = 3.86SIVDD76 pKa = 3.86LSQRR80 pKa = 11.84PHH82 pKa = 6.85NKK84 pKa = 8.65MEE86 pKa = 4.16EE87 pKa = 4.22SSLHH91 pKa = 6.42DD92 pKa = 4.4DD93 pKa = 4.14KK94 pKa = 11.55AIKK97 pKa = 9.95QATQLNTDD105 pKa = 3.88YY106 pKa = 11.35NQLRR110 pKa = 11.84SPNANSIGGQSVIKK124 pKa = 10.42DD125 pKa = 3.39VSSEE129 pKa = 3.97RR130 pKa = 11.84KK131 pKa = 9.47PPVNQIPEE139 pKa = 4.12DD140 pKa = 3.67QQIYY144 pKa = 8.94PSQMYY149 pKa = 9.45PLLEE153 pKa = 4.25VPEE156 pKa = 5.12SYY158 pKa = 10.64HH159 pKa = 7.85SLIPKK164 pKa = 9.31LQFFFKK170 pKa = 10.87YY171 pKa = 9.72YY172 pKa = 11.07GLYY175 pKa = 9.84EE176 pKa = 4.67DD177 pKa = 4.21SDD179 pKa = 4.56YY180 pKa = 11.88VVDD183 pKa = 5.45KK184 pKa = 11.1DD185 pKa = 3.49NQGYY189 pKa = 8.78YY190 pKa = 10.35FYY192 pKa = 8.72PTKK195 pKa = 10.51KK196 pKa = 7.37WTTRR200 pKa = 11.84DD201 pKa = 3.34QKK203 pKa = 11.58EE204 pKa = 3.99LMDD207 pKa = 5.23NISKK211 pKa = 10.85GVDD214 pKa = 3.11HH215 pKa = 8.08DD216 pKa = 5.77DD217 pKa = 3.64NLLDD221 pKa = 4.81LEE223 pKa = 4.96EE224 pKa = 4.39KK225 pKa = 10.33TSDD228 pKa = 3.64NLFEE232 pKa = 4.93EE233 pKa = 4.6NLNVHH238 pKa = 5.69QLVDD242 pKa = 4.37FVTKK246 pKa = 10.38GFYY249 pKa = 9.7VEE251 pKa = 4.08KK252 pKa = 10.68RR253 pKa = 11.84NIKK256 pKa = 9.31GKK258 pKa = 10.94YY259 pKa = 9.03YY260 pKa = 10.74FDD262 pKa = 3.95INNPSLNINKK272 pKa = 9.22IANVDD277 pKa = 3.85CQDD280 pKa = 4.37KK281 pKa = 10.8ILSAKK286 pKa = 9.92EE287 pKa = 3.87KK288 pKa = 10.13IDD290 pKa = 4.06MIFKK294 pKa = 10.68ASGIYY299 pKa = 9.93RR300 pKa = 11.84AMKK303 pKa = 10.51LKK305 pKa = 10.82AKK307 pKa = 8.7WW308 pKa = 3.09
MM1 pKa = 7.18KK2 pKa = 9.89RR3 pKa = 11.84HH4 pKa = 6.68RR5 pKa = 11.84ISIPYY10 pKa = 8.38VTDD13 pKa = 3.12QVLRR17 pKa = 11.84NTSDD21 pKa = 3.44VVDD24 pKa = 4.58PNDD27 pKa = 4.1TVDD30 pKa = 4.27QLISDD35 pKa = 4.14DD36 pKa = 4.05VVNPKK41 pKa = 9.92QDD43 pKa = 3.31LKK45 pKa = 11.26EE46 pKa = 4.06FLDD49 pKa = 3.88SRR51 pKa = 11.84EE52 pKa = 3.88LNYY55 pKa = 9.44RR56 pKa = 11.84TRR58 pKa = 11.84ASLASSYY65 pKa = 11.65DD66 pKa = 3.48DD67 pKa = 5.93DD68 pKa = 4.99DD69 pKa = 4.0WADD72 pKa = 3.86SIVDD76 pKa = 3.86LSQRR80 pKa = 11.84PHH82 pKa = 6.85NKK84 pKa = 8.65MEE86 pKa = 4.16EE87 pKa = 4.22SSLHH91 pKa = 6.42DD92 pKa = 4.4DD93 pKa = 4.14KK94 pKa = 11.55AIKK97 pKa = 9.95QATQLNTDD105 pKa = 3.88YY106 pKa = 11.35NQLRR110 pKa = 11.84SPNANSIGGQSVIKK124 pKa = 10.42DD125 pKa = 3.39VSSEE129 pKa = 3.97RR130 pKa = 11.84KK131 pKa = 9.47PPVNQIPEE139 pKa = 4.12DD140 pKa = 3.67QQIYY144 pKa = 8.94PSQMYY149 pKa = 9.45PLLEE153 pKa = 4.25VPEE156 pKa = 5.12SYY158 pKa = 10.64HH159 pKa = 7.85SLIPKK164 pKa = 9.31LQFFFKK170 pKa = 10.87YY171 pKa = 9.72YY172 pKa = 11.07GLYY175 pKa = 9.84EE176 pKa = 4.67DD177 pKa = 4.21SDD179 pKa = 4.56YY180 pKa = 11.88VVDD183 pKa = 5.45KK184 pKa = 11.1DD185 pKa = 3.49NQGYY189 pKa = 8.78YY190 pKa = 10.35FYY192 pKa = 8.72PTKK195 pKa = 10.51KK196 pKa = 7.37WTTRR200 pKa = 11.84DD201 pKa = 3.34QKK203 pKa = 11.58EE204 pKa = 3.99LMDD207 pKa = 5.23NISKK211 pKa = 10.85GVDD214 pKa = 3.11HH215 pKa = 8.08DD216 pKa = 5.77DD217 pKa = 3.64NLLDD221 pKa = 4.81LEE223 pKa = 4.96EE224 pKa = 4.39KK225 pKa = 10.33TSDD228 pKa = 3.64NLFEE232 pKa = 4.93EE233 pKa = 4.6NLNVHH238 pKa = 5.69QLVDD242 pKa = 4.37FVTKK246 pKa = 10.38GFYY249 pKa = 9.7VEE251 pKa = 4.08KK252 pKa = 10.68RR253 pKa = 11.84NIKK256 pKa = 9.31GKK258 pKa = 10.94YY259 pKa = 9.03YY260 pKa = 10.74FDD262 pKa = 3.95INNPSLNINKK272 pKa = 9.22IANVDD277 pKa = 3.85CQDD280 pKa = 4.37KK281 pKa = 10.8ILSAKK286 pKa = 9.92EE287 pKa = 3.87KK288 pKa = 10.13IDD290 pKa = 4.06MIFKK294 pKa = 10.68ASGIYY299 pKa = 9.93RR300 pKa = 11.84AMKK303 pKa = 10.51LKK305 pKa = 10.82AKK307 pKa = 8.7WW308 pKa = 3.09
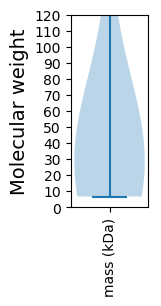
Molecular weight: 35.91 kDa
Isoelectric point according different methods:
Protein with the highest isoelectric point:
>sp|D8V078|L_TIBVC RNA-directed RNA polymerase L OS=Tibrogargan virus (strain CS132) OX=1559361 GN=L PE=3 SV=1
MM1 pKa = 7.39SKK3 pKa = 10.39VGPNPFLQFYY13 pKa = 10.65LNAKK17 pKa = 9.69NDD19 pKa = 4.19FINWVSIIWGKK30 pKa = 10.14IRR32 pKa = 11.84MIALVITLIVAFIFLIKK49 pKa = 10.37LIKK52 pKa = 9.81SCIYY56 pKa = 10.43LVSLCKK62 pKa = 10.63GCLTKK67 pKa = 10.32TLTFKK72 pKa = 11.24NKK74 pKa = 9.39IIKK77 pKa = 8.47WNIWKK82 pKa = 9.84KK83 pKa = 9.6IKK85 pKa = 10.28RR86 pKa = 11.84RR87 pKa = 11.84TPRR90 pKa = 11.84EE91 pKa = 3.99SRR93 pKa = 11.84LKK95 pKa = 10.64DD96 pKa = 3.34CPIYY100 pKa = 10.84LNNPNFQLNN109 pKa = 3.44
MM1 pKa = 7.39SKK3 pKa = 10.39VGPNPFLQFYY13 pKa = 10.65LNAKK17 pKa = 9.69NDD19 pKa = 4.19FINWVSIIWGKK30 pKa = 10.14IRR32 pKa = 11.84MIALVITLIVAFIFLIKK49 pKa = 10.37LIKK52 pKa = 9.81SCIYY56 pKa = 10.43LVSLCKK62 pKa = 10.63GCLTKK67 pKa = 10.32TLTFKK72 pKa = 11.24NKK74 pKa = 9.39IIKK77 pKa = 8.47WNIWKK82 pKa = 9.84KK83 pKa = 9.6IKK85 pKa = 10.28RR86 pKa = 11.84RR87 pKa = 11.84TPRR90 pKa = 11.84EE91 pKa = 3.99SRR93 pKa = 11.84LKK95 pKa = 10.64DD96 pKa = 3.34CPIYY100 pKa = 10.84LNNPNFQLNN109 pKa = 3.44
Molecular weight: 12.88 kDa
Isoelectric point according different methods:
Peptides (in silico digests for buttom-up proteomics)
Below you can find in silico digests of the whole proteome with Trypsin, Chymotrypsin, Trypsin+LysC, LysN, ArgC proteases suitable for different mass spec machines.| Try ESI |
 |
|---|
| ChTry ESI |
|
|---|
| ArgC ESI |
|
|---|
| LysN ESI |
|
|---|
| TryLysC ESI |
|
|---|
| Try MALDI |
|
|---|
| ChTry MALDI |
|
|---|
| ArgC MALDI |
|
|---|
| LysN MALDI |
|
|---|
| TryLysC MALDI |
|
|---|
| Try LTQ |
|
|---|
| ChTry LTQ |
|
|---|
| ArgC LTQ |
|
|---|
| LysN LTQ |
|
|---|
| TryLysC LTQ |
|
|---|
| Try MSlow |
|
|---|
| ChTry MSlow |
|
|---|
| ArgC MSlow |
|
|---|
| LysN MSlow |
|
|---|
| TryLysC MSlow |
|
|---|
| Try MShigh |
|
|---|
| ChTry MShigh |
|
|---|
| ArgC MShigh |
|
|---|
| LysN MShigh |
|
|---|
| TryLysC MShigh |
|
|---|
General Statistics
Number of major isoforms |
Number of additional isoforms |
Number of all proteins |
Number of amino acids |
Min. Seq. Length |
Max. Seq. Length |
Avg. Seq. Length |
Avg. Mol. Weight |
|---|---|---|---|---|---|---|---|
0 |
4253 |
55 |
2119 |
472.6 |
54.57 |
Amino acid frequency
Ala |
Cys |
Asp |
Glu |
Phe |
Gly |
His |
Ile |
Lys |
Leu |
|---|---|---|---|---|---|---|---|---|---|
3.151 ± 0.263 | 2.234 ± 0.299 |
6.49 ± 0.763 | 5.055 ± 0.223 |
4.397 ± 0.291 | 4.797 ± 0.412 |
2.68 ± 0.503 | 8.229 ± 0.382 |
7.312 ± 0.536 | 10.087 ± 0.831 |
Met |
Asn |
Gln |
Pro |
Arg |
Ser |
Thr |
Val |
Trp |
Tyr |
|---|---|---|---|---|---|---|---|---|---|
2.398 ± 0.289 | 6.889 ± 0.246 |
3.833 ± 0.2 | 3.48 ± 0.316 |
4.209 ± 0.192 | 7.83 ± 0.518 |
5.667 ± 0.467 | 4.914 ± 0.277 |
1.669 ± 0.118 | 4.679 ± 0.18 |
Most of the basic statistics you can see at this page can be downloaded from this CSV file
See this proteome in:

Proteome-pI is available under Creative Commons Attribution-NoDerivs license, for more details see here
| Reference: Kozlowski LP. Proteome-pI 2.0: Proteome Isoelectric Point Database Update. Nucleic Acids Res. 2021, doi: 10.1093/nar/gkab944 | Contact: Lukasz P. Kozlowski |