Paenibacillus sabinae T27
Taxonomy: cellular organisms; Bacteria; Terrabacteria group; Firmicutes; Bacilli; Bacillales; Paenibacillaceae; Paenibacillus; Paenibacillus sabinae
Average proteome isoelectric point is 6.39
Get precalculated fractions of proteins
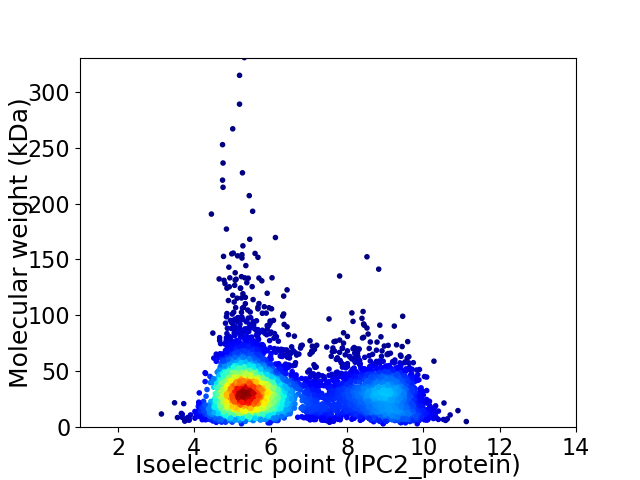
Virtual 2D-PAGE plot for 4776 proteins (isoelectric point calculated using IPC2_protein)
Get csv file with sequences according to given criteria:
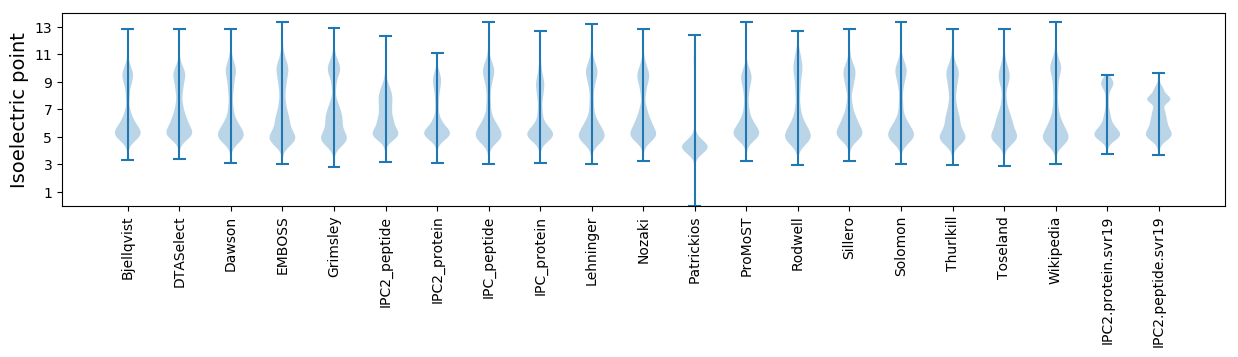
* You can choose from 21 different methods for calculating isoelectric point
Summary statistics related to proteome-wise predictions
Protein with the lowest isoelectric point:
>tr|X4ZTA3|X4ZTA3_9BACL Beta-lactamase superfamily metal-dependent hydrolase OS=Paenibacillus sabinae T27 OX=1268072 GN=PSAB_24025 PE=4 SV=1
MM1 pKa = 7.01YY2 pKa = 10.11VVCKK6 pKa = 10.2EE7 pKa = 3.99HH8 pKa = 7.37LEE10 pKa = 4.01LAIDD14 pKa = 3.77MFVDD18 pKa = 4.63EE19 pKa = 5.69YY20 pKa = 11.3EE21 pKa = 4.52DD22 pKa = 4.3APDD25 pKa = 4.18VVDD28 pKa = 5.74LKK30 pKa = 10.84DD31 pKa = 3.61TEE33 pKa = 4.35FSDD36 pKa = 3.33WDD38 pKa = 3.95PPAKK42 pKa = 10.2CAEE45 pKa = 4.22CEE47 pKa = 4.06KK48 pKa = 10.24NAEE51 pKa = 4.19YY52 pKa = 10.83LVVV55 pKa = 3.5
MM1 pKa = 7.01YY2 pKa = 10.11VVCKK6 pKa = 10.2EE7 pKa = 3.99HH8 pKa = 7.37LEE10 pKa = 4.01LAIDD14 pKa = 3.77MFVDD18 pKa = 4.63EE19 pKa = 5.69YY20 pKa = 11.3EE21 pKa = 4.52DD22 pKa = 4.3APDD25 pKa = 4.18VVDD28 pKa = 5.74LKK30 pKa = 10.84DD31 pKa = 3.61TEE33 pKa = 4.35FSDD36 pKa = 3.33WDD38 pKa = 3.95PPAKK42 pKa = 10.2CAEE45 pKa = 4.22CEE47 pKa = 4.06KK48 pKa = 10.24NAEE51 pKa = 4.19YY52 pKa = 10.83LVVV55 pKa = 3.5
Molecular weight: 6.37 kDa
Isoelectric point according different methods:
Protein with the highest isoelectric point:
>tr|X4ZSL2|X4ZSL2_9BACL Uncharacterized protein OS=Paenibacillus sabinae T27 OX=1268072 GN=PSAB_02335 PE=4 SV=1
MM1 pKa = 7.9RR2 pKa = 11.84PTFKK6 pKa = 10.82PNVSKK11 pKa = 10.8RR12 pKa = 11.84KK13 pKa = 8.79KK14 pKa = 8.3VHH16 pKa = 5.4GFRR19 pKa = 11.84ARR21 pKa = 11.84MSTKK25 pKa = 10.19NGRR28 pKa = 11.84KK29 pKa = 8.87VLAARR34 pKa = 11.84RR35 pKa = 11.84LKK37 pKa = 10.2GRR39 pKa = 11.84KK40 pKa = 8.79VLSAA44 pKa = 4.05
MM1 pKa = 7.9RR2 pKa = 11.84PTFKK6 pKa = 10.82PNVSKK11 pKa = 10.8RR12 pKa = 11.84KK13 pKa = 8.79KK14 pKa = 8.3VHH16 pKa = 5.4GFRR19 pKa = 11.84ARR21 pKa = 11.84MSTKK25 pKa = 10.19NGRR28 pKa = 11.84KK29 pKa = 8.87VLAARR34 pKa = 11.84RR35 pKa = 11.84LKK37 pKa = 10.2GRR39 pKa = 11.84KK40 pKa = 8.79VLSAA44 pKa = 4.05
Molecular weight: 5.06 kDa
Isoelectric point according different methods:
Peptides (in silico digests for buttom-up proteomics)
Below you can find in silico digests of the whole proteome with Trypsin, Chymotrypsin, Trypsin+LysC, LysN, ArgC proteases suitable for different mass spec machines.| Try ESI |
 |
|---|
| ChTry ESI |
|
|---|
| ArgC ESI |
|
|---|
| LysN ESI |
|
|---|
| TryLysC ESI |
|
|---|
| Try MALDI |
|
|---|
| ChTry MALDI |
|
|---|
| ArgC MALDI |
|
|---|
| LysN MALDI |
|
|---|
| TryLysC MALDI |
|
|---|
| Try LTQ |
|
|---|
| ChTry LTQ |
|
|---|
| ArgC LTQ |
|
|---|
| LysN LTQ |
|
|---|
| TryLysC LTQ |
|
|---|
| Try MSlow |
|
|---|
| ChTry MSlow |
|
|---|
| ArgC MSlow |
|
|---|
| LysN MSlow |
|
|---|
| TryLysC MSlow |
|
|---|
| Try MShigh |
|
|---|
| ChTry MShigh |
|
|---|
| ArgC MShigh |
|
|---|
| LysN MShigh |
|
|---|
| TryLysC MShigh |
|
|---|
General Statistics
Number of major isoforms |
Number of additional isoforms |
Number of all proteins |
Number of amino acids |
Min. Seq. Length |
Max. Seq. Length |
Avg. Seq. Length |
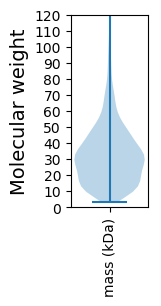
Avg. Mol. Weight |
|---|---|---|---|---|---|---|---|
0 |
1487397 |
26 |
3037 |
311.4 |
34.49 |
Amino acid frequency
Ala |
Cys |
Asp |
Glu |
Phe |
Gly |
His |
Ile |
Lys |
Leu |
|---|---|---|---|---|---|---|---|---|---|
8.799 ± 0.048 | 0.796 ± 0.011 |
5.016 ± 0.026 | 6.86 ± 0.04 |
4.016 ± 0.023 | 7.993 ± 0.04 |
1.987 ± 0.017 | 6.509 ± 0.028 |
5.245 ± 0.029 | 10.34 ± 0.048 |
Met |
Asn |
Gln |
Pro |
Arg |
Ser |
Thr |
Val |
Trp |
Tyr |
|---|---|---|---|---|---|---|---|---|---|
2.692 ± 0.019 | 3.516 ± 0.025 |
4.224 ± 0.022 | 3.468 ± 0.024 |
5.436 ± 0.035 | 6.437 ± 0.027 |
5.152 ± 0.027 | 6.973 ± 0.026 |
1.183 ± 0.016 | 3.356 ± 0.024 |
Most of the basic statistics you can see at this page can be downloaded from this CSV file
See this proteome in:

Proteome-pI is available under Creative Commons Attribution-NoDerivs license, for more details see here
| Reference: Kozlowski LP. Proteome-pI 2.0: Proteome Isoelectric Point Database Update. Nucleic Acids Res. 2021, doi: 10.1093/nar/gkab944 | Contact: Lukasz P. Kozlowski |