Streptococcus satellite phage Javan600
Taxonomy: Viruses; unclassified bacterial viruses
Average proteome isoelectric point is 6.72
Get precalculated fractions of proteins
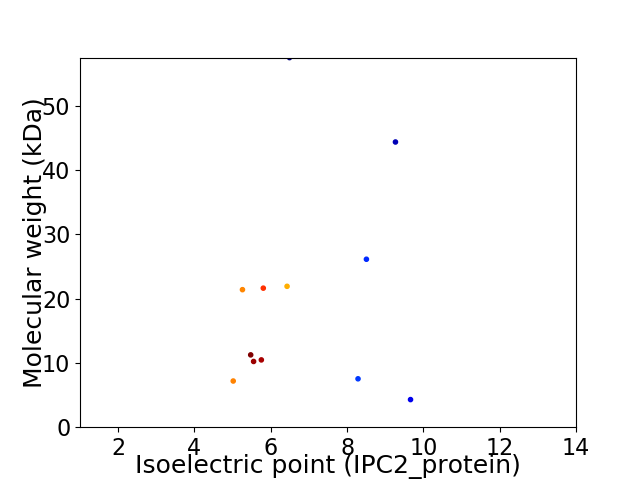
Virtual 2D-PAGE plot for 12 proteins (isoelectric point calculated using IPC2_protein)
Get csv file with sequences according to given criteria:
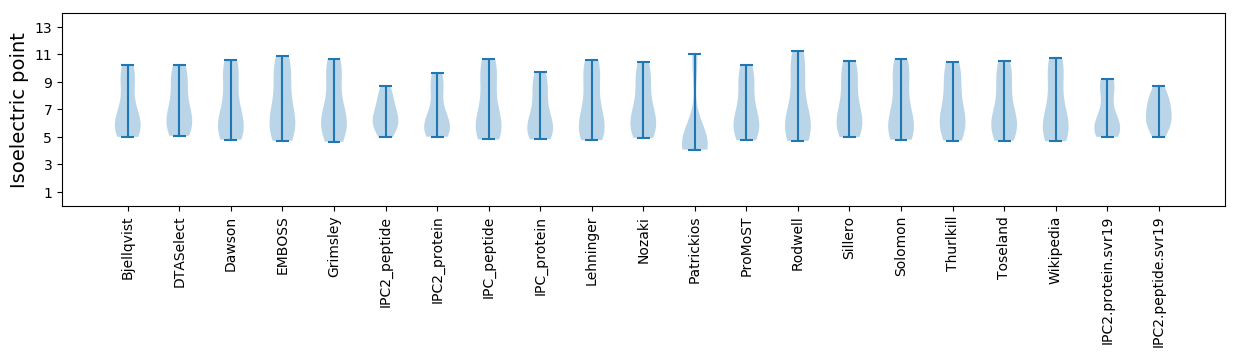
* You can choose from 21 different methods for calculating isoelectric point
Summary statistics related to proteome-wise predictions
Protein with the lowest isoelectric point:
>tr|A0A4D5ZRJ5|A0A4D5ZRJ5_9VIRU Uncharacterized protein OS=Streptococcus satellite phage Javan600 OX=2558769 GN=JavanS600_0002 PE=4 SV=1
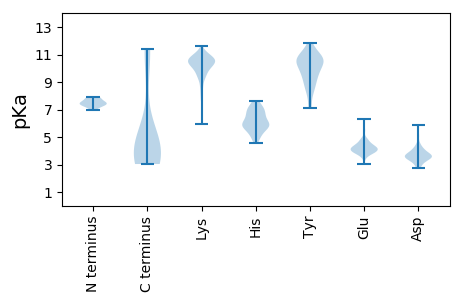
MM1 pKa = 7.62KK2 pKa = 10.14IKK4 pKa = 10.81LFTRR8 pKa = 11.84EE9 pKa = 3.95HH10 pKa = 6.52VSDD13 pKa = 5.89GIHH16 pKa = 5.4EE17 pKa = 4.29TLGFEE22 pKa = 4.81KK23 pKa = 10.52FRR25 pKa = 11.84IEE27 pKa = 3.85NDD29 pKa = 3.29VEE31 pKa = 4.2FEE33 pKa = 4.01TRR35 pKa = 11.84INDD38 pKa = 3.32FMIDD42 pKa = 3.44KK43 pKa = 10.52NVVSVQSLKK52 pKa = 11.17DD53 pKa = 3.7SVFVTYY59 pKa = 11.13ADD61 pKa = 3.35
MM1 pKa = 7.62KK2 pKa = 10.14IKK4 pKa = 10.81LFTRR8 pKa = 11.84EE9 pKa = 3.95HH10 pKa = 6.52VSDD13 pKa = 5.89GIHH16 pKa = 5.4EE17 pKa = 4.29TLGFEE22 pKa = 4.81KK23 pKa = 10.52FRR25 pKa = 11.84IEE27 pKa = 3.85NDD29 pKa = 3.29VEE31 pKa = 4.2FEE33 pKa = 4.01TRR35 pKa = 11.84INDD38 pKa = 3.32FMIDD42 pKa = 3.44KK43 pKa = 10.52NVVSVQSLKK52 pKa = 11.17DD53 pKa = 3.7SVFVTYY59 pKa = 11.13ADD61 pKa = 3.35
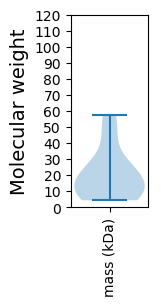
Molecular weight: 7.18 kDa
Isoelectric point according different methods:
Protein with the highest isoelectric point:
>tr|A0A4D5ZRK7|A0A4D5ZRK7_9VIRU Integrase/recombinase OS=Streptococcus satellite phage Javan600 OX=2558769 GN=JavanS600_0012 PE=3 SV=1
MM1 pKa = 7.41KK2 pKa = 10.57RR3 pKa = 11.84LGYY6 pKa = 10.64LSAFKK11 pKa = 10.61LLKK14 pKa = 10.5KK15 pKa = 10.45VDD17 pKa = 3.58IKK19 pKa = 10.96RR20 pKa = 11.84PNYY23 pKa = 10.39GKK25 pKa = 9.06MLEE28 pKa = 4.25NVGINAIDD36 pKa = 3.23RR37 pKa = 4.1
MM1 pKa = 7.41KK2 pKa = 10.57RR3 pKa = 11.84LGYY6 pKa = 10.64LSAFKK11 pKa = 10.61LLKK14 pKa = 10.5KK15 pKa = 10.45VDD17 pKa = 3.58IKK19 pKa = 10.96RR20 pKa = 11.84PNYY23 pKa = 10.39GKK25 pKa = 9.06MLEE28 pKa = 4.25NVGINAIDD36 pKa = 3.23RR37 pKa = 4.1
Molecular weight: 4.29 kDa
Isoelectric point according different methods:
Peptides (in silico digests for buttom-up proteomics)
Below you can find in silico digests of the whole proteome with Trypsin, Chymotrypsin, Trypsin+LysC, LysN, ArgC proteases suitable for different mass spec machines.| Try ESI |
 |
|---|
| ChTry ESI |
|
|---|
| ArgC ESI |
|
|---|
| LysN ESI |
|
|---|
| TryLysC ESI |
|
|---|
| Try MALDI |
|
|---|
| ChTry MALDI |
|
|---|
| ArgC MALDI |
|
|---|
| LysN MALDI |
|
|---|
| TryLysC MALDI |
|
|---|
| Try LTQ |
|
|---|
| ChTry LTQ |
|
|---|
| ArgC LTQ |
|
|---|
| LysN LTQ |
|
|---|
| TryLysC LTQ |
|
|---|
| Try MSlow |
|
|---|
| ChTry MSlow |
|
|---|
| ArgC MSlow |
|
|---|
| LysN MSlow |
|
|---|
| TryLysC MSlow |
|
|---|
| Try MShigh |
|
|---|
| ChTry MShigh |
|
|---|
| ArgC MShigh |
|
|---|
| LysN MShigh |
|
|---|
| TryLysC MShigh |
|
|---|
General Statistics
Number of major isoforms |
Number of additional isoforms |
Number of all proteins |
Number of amino acids |
Min. Seq. Length |
Max. Seq. Length |
Avg. Seq. Length |
Avg. Mol. Weight |
|---|---|---|---|---|---|---|---|
0 |
2138 |
37 |
502 |
178.2 |
20.32 |
Amino acid frequency
Ala |
Cys |
Asp |
Glu |
Phe |
Gly |
His |
Ile |
Lys |
Leu |
|---|---|---|---|---|---|---|---|---|---|
6.034 ± 0.403 | 0.421 ± 0.133 |
5.706 ± 0.442 | 7.343 ± 0.788 |
3.648 ± 0.565 | 5.332 ± 0.238 |
1.731 ± 0.388 | 6.221 ± 0.452 |
9.916 ± 0.55 | 9.121 ± 0.761 |
Met |
Asn |
Gln |
Pro |
Arg |
Ser |
Thr |
Val |
Trp |
Tyr |
|---|---|---|---|---|---|---|---|---|---|
2.292 ± 0.278 | 6.829 ± 0.631 |
3.601 ± 0.77 | 3.742 ± 1.097 |
4.163 ± 0.41 | 5.847 ± 0.667 |
7.016 ± 0.893 | 5.753 ± 0.488 |
0.935 ± 0.154 | 4.35 ± 0.322 |
Most of the basic statistics you can see at this page can be downloaded from this CSV file
See this proteome in:

Proteome-pI is available under Creative Commons Attribution-NoDerivs license, for more details see here
| Reference: Kozlowski LP. Proteome-pI 2.0: Proteome Isoelectric Point Database Update. Nucleic Acids Res. 2021, doi: 10.1093/nar/gkab944 | Contact: Lukasz P. Kozlowski |