Acidianus rod-shaped virus 1
Taxonomy: Viruses; Adnaviria; Zilligvirae; Taleaviricota; Tokiviricetes; Ligamenvirales; Rudiviridae; Itarudivirus; Itarudivirus ARV1
Average proteome isoelectric point is 6.64
Get precalculated fractions of proteins
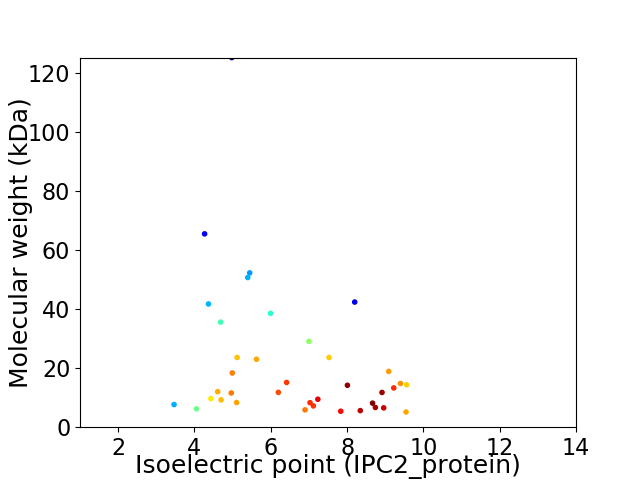
Virtual 2D-PAGE plot for 38 proteins (isoelectric point calculated using IPC2_protein)
Get csv file with sequences according to given criteria:
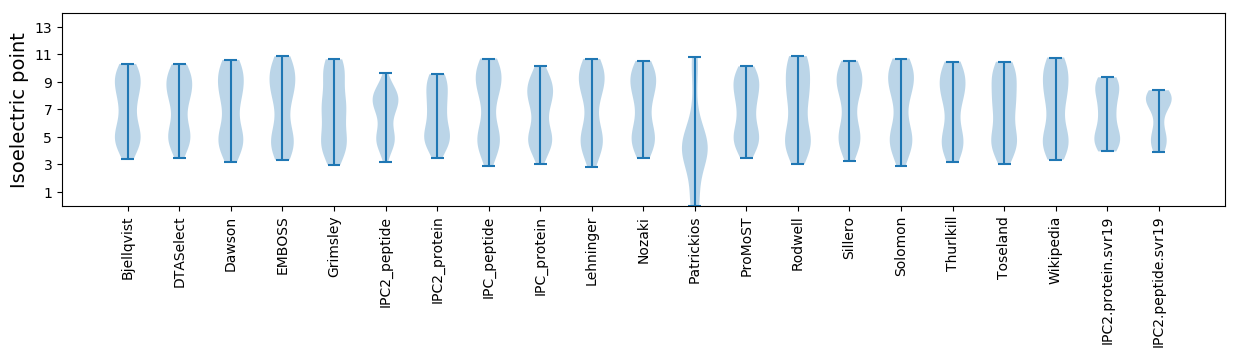
* You can choose from 21 different methods for calculating isoelectric point
Summary statistics related to proteome-wise predictions
Protein with the lowest isoelectric point:
>tr|Q50I58|Q50I58_9VIRU Uncharacterized protein OS=Acidianus rod-shaped virus 1 OX=309181 PE=4 SV=1
MM1 pKa = 7.99DD2 pKa = 5.74EE3 pKa = 5.12DD4 pKa = 4.14SQIPTCFDD12 pKa = 3.0ILKK15 pKa = 10.65SNGYY19 pKa = 7.69NLKK22 pKa = 10.41GYY24 pKa = 9.84SQDD27 pKa = 3.89TILLLQTAHH36 pKa = 6.96GSFEE40 pKa = 4.0EE41 pKa = 4.76CEE43 pKa = 4.25TYY45 pKa = 11.25LFMLEE50 pKa = 3.9IQYY53 pKa = 11.01GG54 pKa = 3.5
MM1 pKa = 7.99DD2 pKa = 5.74EE3 pKa = 5.12DD4 pKa = 4.14SQIPTCFDD12 pKa = 3.0ILKK15 pKa = 10.65SNGYY19 pKa = 7.69NLKK22 pKa = 10.41GYY24 pKa = 9.84SQDD27 pKa = 3.89TILLLQTAHH36 pKa = 6.96GSFEE40 pKa = 4.0EE41 pKa = 4.76CEE43 pKa = 4.25TYY45 pKa = 11.25LFMLEE50 pKa = 3.9IQYY53 pKa = 11.01GG54 pKa = 3.5
Molecular weight: 6.21 kDa
Isoelectric point according different methods:
Protein with the highest isoelectric point:
>tr|Q50I31|Q50I31_9VIRU Uncharacterized protein OS=Acidianus rod-shaped virus 1 OX=309181 PE=4 SV=1
MM1 pKa = 7.77YY2 pKa = 10.6FMGCWQVGVSGFRR15 pKa = 11.84QVRR18 pKa = 11.84VQKK21 pKa = 10.72IFGEE25 pKa = 4.26KK26 pKa = 9.11CSAVITVFRR35 pKa = 11.84TFFTQTRR42 pKa = 11.84VII44 pKa = 3.9
MM1 pKa = 7.77YY2 pKa = 10.6FMGCWQVGVSGFRR15 pKa = 11.84QVRR18 pKa = 11.84VQKK21 pKa = 10.72IFGEE25 pKa = 4.26KK26 pKa = 9.11CSAVITVFRR35 pKa = 11.84TFFTQTRR42 pKa = 11.84VII44 pKa = 3.9
Molecular weight: 5.15 kDa
Isoelectric point according different methods:
Peptides (in silico digests for buttom-up proteomics)
Below you can find in silico digests of the whole proteome with Trypsin, Chymotrypsin, Trypsin+LysC, LysN, ArgC proteases suitable for different mass spec machines.| Try ESI |
 |
|---|
| ChTry ESI |
|
|---|
| ArgC ESI |
|
|---|
| LysN ESI |
|
|---|
| TryLysC ESI |
|
|---|
| Try MALDI |
|
|---|
| ChTry MALDI |
|
|---|
| ArgC MALDI |
|
|---|
| LysN MALDI |
|
|---|
| TryLysC MALDI |
|
|---|
| Try LTQ |
|
|---|
| ChTry LTQ |
|
|---|
| ArgC LTQ |
|
|---|
| LysN LTQ |
|
|---|
| TryLysC LTQ |
|
|---|
| Try MSlow |
|
|---|
| ChTry MSlow |
|
|---|
| ArgC MSlow |
|
|---|
| LysN MSlow |
|
|---|
| TryLysC MSlow |
|
|---|
| Try MShigh |
|
|---|
| ChTry MShigh |
|
|---|
| ArgC MShigh |
|
|---|
| LysN MShigh |
|
|---|
| TryLysC MShigh |
|
|---|
General Statistics
Number of major isoforms |
Number of additional isoforms |
Number of all proteins |
Number of amino acids |
Min. Seq. Length |
Max. Seq. Length |
Avg. Seq. Length |
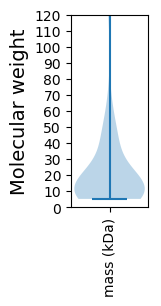
Avg. Mol. Weight |
|---|---|---|---|---|---|---|---|
0 |
7204 |
44 |
1115 |
189.6 |
21.53 |
Amino acid frequency
Ala |
Cys |
Asp |
Glu |
Phe |
Gly |
His |
Ile |
Lys |
Leu |
|---|---|---|---|---|---|---|---|---|---|
6.455 ± 0.417 | 1.11 ± 0.251 |
5.261 ± 0.343 | 5.303 ± 0.497 |
5.4 ± 0.432 | 4.775 ± 0.258 |
1.61 ± 0.203 | 8.079 ± 0.391 |
6.108 ± 0.515 | 9.273 ± 0.562 |
Met |
Asn |
Gln |
Pro |
Arg |
Ser |
Thr |
Val |
Trp |
Tyr |
|---|---|---|---|---|---|---|---|---|---|
2.249 ± 0.175 | 5.677 ± 0.412 |
4.275 ± 0.374 | 4.72 ± 0.368 |
3.47 ± 0.321 | 7.482 ± 0.56 |
5.858 ± 0.295 | 6.621 ± 0.332 |
0.93 ± 0.154 | 5.344 ± 0.352 |
Most of the basic statistics you can see at this page can be downloaded from this CSV file
See this proteome in:

Proteome-pI is available under Creative Commons Attribution-NoDerivs license, for more details see here
| Reference: Kozlowski LP. Proteome-pI 2.0: Proteome Isoelectric Point Database Update. Nucleic Acids Res. 2021, doi: 10.1093/nar/gkab944 | Contact: Lukasz P. Kozlowski |