Streptococcus satellite phage Javan277
Taxonomy: Viruses; Duplodnaviria; Heunggongvirae; Uroviricota; Caudoviricetes; Caudovirales; Siphoviridae; unclassified Siphoviridae
Average proteome isoelectric point is 6.62
Get precalculated fractions of proteins
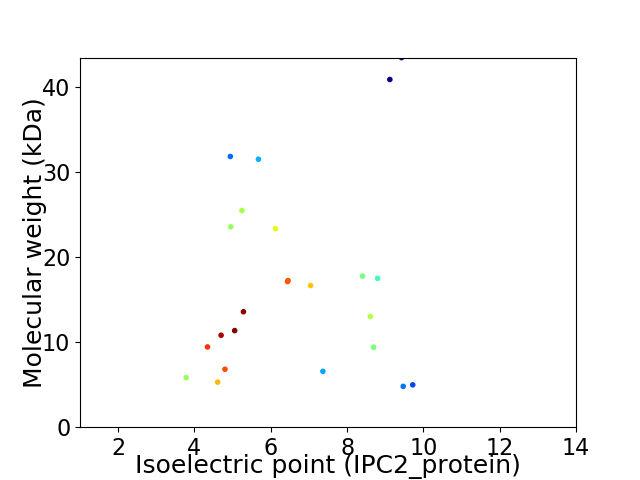
Virtual 2D-PAGE plot for 24 proteins (isoelectric point calculated using IPC2_protein)
Get csv file with sequences according to given criteria:
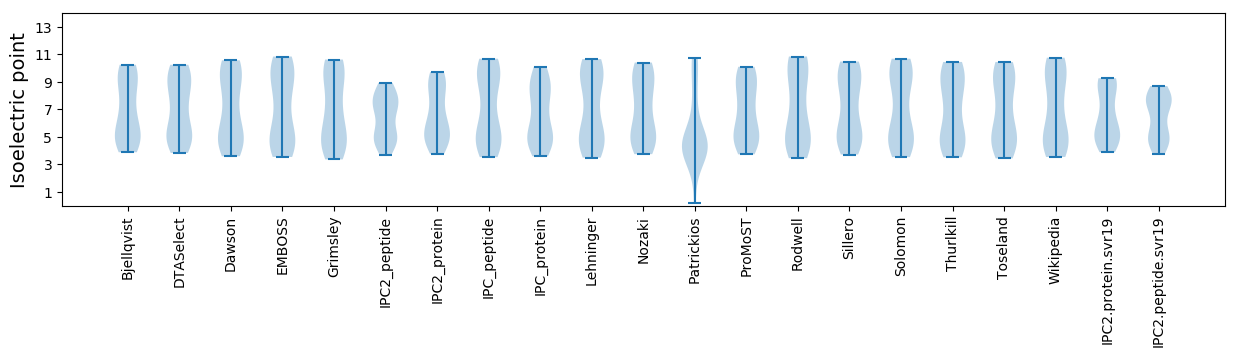
* You can choose from 21 different methods for calculating isoelectric point
Summary statistics related to proteome-wise predictions
Protein with the lowest isoelectric point:
>tr|A0A4D5ZHS9|A0A4D5ZHS9_9VIRU Terminase small subunit OS=Streptococcus satellite phage Javan277 OX=2558601 GN=JavanS277_0003 PE=4 SV=1
MM1 pKa = 7.64GEE3 pKa = 3.9LGKK6 pKa = 8.28TQGNFDD12 pKa = 4.15FNIVIEE18 pKa = 4.24EE19 pKa = 3.93EE20 pKa = 4.03GDD22 pKa = 3.72YY23 pKa = 11.38VFYY26 pKa = 10.89FSFNDD31 pKa = 3.58EE32 pKa = 4.49NNQSLDD38 pKa = 2.77TYY40 pKa = 8.74YY41 pKa = 10.91QYY43 pKa = 11.42ISIIKK48 pKa = 8.95EE49 pKa = 3.8
MM1 pKa = 7.64GEE3 pKa = 3.9LGKK6 pKa = 8.28TQGNFDD12 pKa = 4.15FNIVIEE18 pKa = 4.24EE19 pKa = 3.93EE20 pKa = 4.03GDD22 pKa = 3.72YY23 pKa = 11.38VFYY26 pKa = 10.89FSFNDD31 pKa = 3.58EE32 pKa = 4.49NNQSLDD38 pKa = 2.77TYY40 pKa = 8.74YY41 pKa = 10.91QYY43 pKa = 11.42ISIIKK48 pKa = 8.95EE49 pKa = 3.8
Molecular weight: 5.83 kDa
Isoelectric point according different methods:
Protein with the highest isoelectric point:
>tr|A0A4D5ZIA4|A0A4D5ZIA4_9VIRU Uncharacterized protein OS=Streptococcus satellite phage Javan277 OX=2558601 GN=JavanS277_0009 PE=4 SV=1
MM1 pKa = 7.28VFDD4 pKa = 4.0MRR6 pKa = 11.84QHH8 pKa = 6.19RR9 pKa = 11.84RR10 pKa = 11.84FLNFPTLGNLVVVDD24 pKa = 5.03DD25 pKa = 4.83LLSSEE30 pKa = 4.15RR31 pKa = 11.84TPRR34 pKa = 11.84KK35 pKa = 8.49YY36 pKa = 9.19TIKK39 pKa = 10.36II40 pKa = 3.53
MM1 pKa = 7.28VFDD4 pKa = 4.0MRR6 pKa = 11.84QHH8 pKa = 6.19RR9 pKa = 11.84RR10 pKa = 11.84FLNFPTLGNLVVVDD24 pKa = 5.03DD25 pKa = 4.83LLSSEE30 pKa = 4.15RR31 pKa = 11.84TPRR34 pKa = 11.84KK35 pKa = 8.49YY36 pKa = 9.19TIKK39 pKa = 10.36II40 pKa = 3.53
Molecular weight: 4.81 kDa
Isoelectric point according different methods:
Peptides (in silico digests for buttom-up proteomics)
Below you can find in silico digests of the whole proteome with Trypsin, Chymotrypsin, Trypsin+LysC, LysN, ArgC proteases suitable for different mass spec machines.| Try ESI |
 |
|---|
| ChTry ESI |
|
|---|
| ArgC ESI |
|
|---|
| LysN ESI |
|
|---|
| TryLysC ESI |
|
|---|
| Try MALDI |
|
|---|
| ChTry MALDI |
|
|---|
| ArgC MALDI |
|
|---|
| LysN MALDI |
|
|---|
| TryLysC MALDI |
|
|---|
| Try LTQ |
|
|---|
| ChTry LTQ |
|
|---|
| ArgC LTQ |
|
|---|
| LysN LTQ |
|
|---|
| TryLysC LTQ |
|
|---|
| Try MSlow |
|
|---|
| ChTry MSlow |
|
|---|
| ArgC MSlow |
|
|---|
| LysN MSlow |
|
|---|
| TryLysC MSlow |
|
|---|
| Try MShigh |
|
|---|
| ChTry MShigh |
|
|---|
| ArgC MShigh |
|
|---|
| LysN MShigh |
|
|---|
| TryLysC MShigh |
|
|---|
General Statistics
Number of major isoforms |
Number of additional isoforms |
Number of all proteins |
Number of amino acids |
Min. Seq. Length |
Max. Seq. Length |
Avg. Seq. Length |
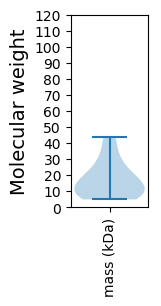
Avg. Mol. Weight |
|---|---|---|---|---|---|---|---|
0 |
3522 |
40 |
381 |
146.8 |
17.02 |
Amino acid frequency
Ala |
Cys |
Asp |
Glu |
Phe |
Gly |
His |
Ile |
Lys |
Leu |
|---|---|---|---|---|---|---|---|---|---|
4.94 ± 0.384 | 0.738 ± 0.137 |
5.451 ± 0.398 | 7.95 ± 0.734 |
4.174 ± 0.322 | 4.373 ± 0.342 |
1.988 ± 0.306 | 8.404 ± 0.402 |
9.398 ± 0.422 | 10.42 ± 0.721 |
Met |
Asn |
Gln |
Pro |
Arg |
Ser |
Thr |
Val |
Trp |
Tyr |
|---|---|---|---|---|---|---|---|---|---|
2.924 ± 0.309 | 5.423 ± 0.461 |
2.328 ± 0.222 | 4.571 ± 0.38 |
4.259 ± 0.449 | 6.161 ± 0.309 |
6.161 ± 0.467 | 4.94 ± 0.405 |
0.965 ± 0.203 | 4.429 ± 0.264 |
Most of the basic statistics you can see at this page can be downloaded from this CSV file
See this proteome in:

Proteome-pI is available under Creative Commons Attribution-NoDerivs license, for more details see here
| Reference: Kozlowski LP. Proteome-pI 2.0: Proteome Isoelectric Point Database Update. Nucleic Acids Res. 2021, doi: 10.1093/nar/gkab944 | Contact: Lukasz P. Kozlowski |