Desulfovibrio sp. 86
Taxonomy: cellular organisms; Bacteria; Proteobacteria; delta/epsilon subdivisions; Deltaproteobacteria; Desulfovibrionales; Desulfovibrionaceae; Desulfovibrio; unclassified Desulfovibrio
Average proteome isoelectric point is 6.88
Get precalculated fractions of proteins
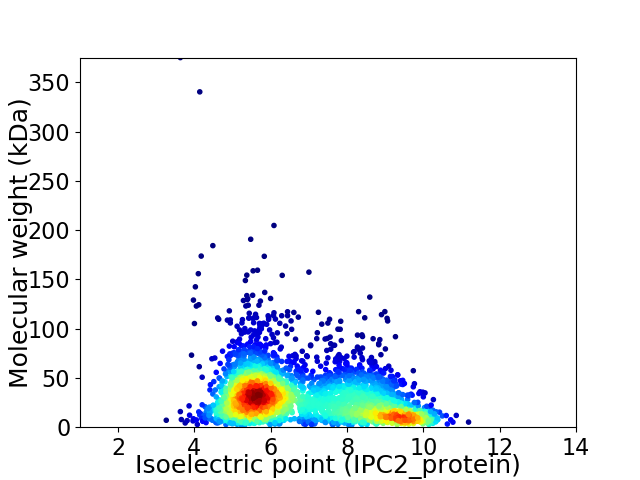
Virtual 2D-PAGE plot for 3292 proteins (isoelectric point calculated using IPC2_protein)
Get csv file with sequences according to given criteria:
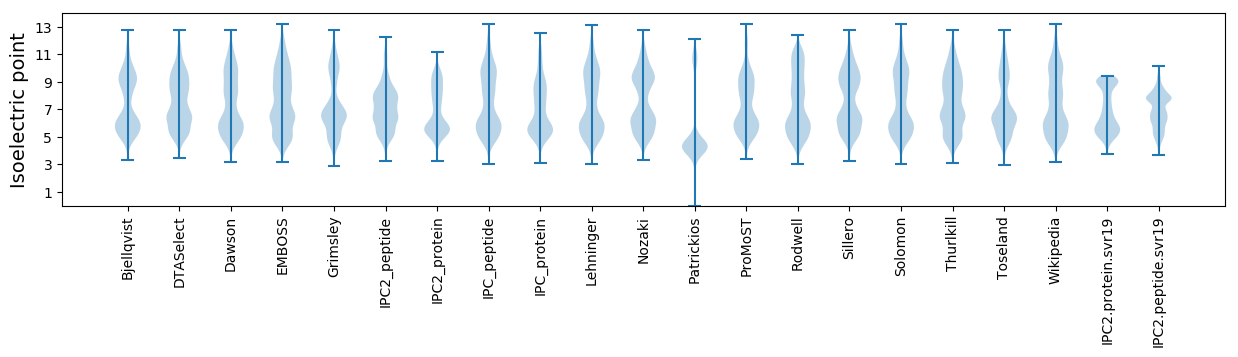
* You can choose from 21 different methods for calculating isoelectric point
Summary statistics related to proteome-wise predictions
Protein with the lowest isoelectric point:
>tr|A0A6N3I9B6|A0A6N3I9B6_9DELT HTH hxlR-type domain-containing protein OS=Desulfovibrio sp. 86 OX=2666132 GN=DESU86_0651 PE=4 SV=1
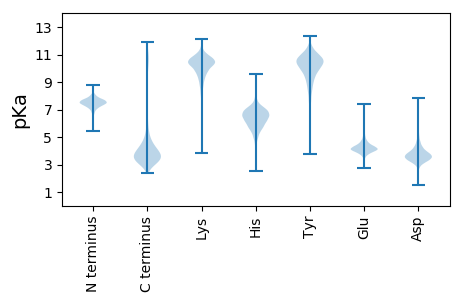
MM1 pKa = 6.63TQEE4 pKa = 3.94TTLEE8 pKa = 3.72DD9 pKa = 3.62SMRR12 pKa = 11.84NDD14 pKa = 3.83TACSIQSLSPSVSPLGNGCRR34 pKa = 11.84EE35 pKa = 4.11ATDD38 pKa = 3.4ASSVVTQEE46 pKa = 4.12ATDD49 pKa = 3.79KK50 pKa = 11.57DD51 pKa = 4.24SMSNYY56 pKa = 9.77ASCSAA61 pKa = 4.14
MM1 pKa = 6.63TQEE4 pKa = 3.94TTLEE8 pKa = 3.72DD9 pKa = 3.62SMRR12 pKa = 11.84NDD14 pKa = 3.83TACSIQSLSPSVSPLGNGCRR34 pKa = 11.84EE35 pKa = 4.11ATDD38 pKa = 3.4ASSVVTQEE46 pKa = 4.12ATDD49 pKa = 3.79KK50 pKa = 11.57DD51 pKa = 4.24SMSNYY56 pKa = 9.77ASCSAA61 pKa = 4.14
Molecular weight: 6.38 kDa
Isoelectric point according different methods:
Protein with the highest isoelectric point:
>tr|A0A6N3I830|A0A6N3I830_9DELT Uncharacterized protein OS=Desulfovibrio sp. 86 OX=2666132 GN=DESU86_1028 PE=4 SV=1
MM1 pKa = 7.35KK2 pKa = 9.43RR3 pKa = 11.84TYY5 pKa = 10.07QPSKK9 pKa = 9.07IRR11 pKa = 11.84RR12 pKa = 11.84ARR14 pKa = 11.84THH16 pKa = 5.96GFRR19 pKa = 11.84ARR21 pKa = 11.84MATPGGRR28 pKa = 11.84AILRR32 pKa = 11.84RR33 pKa = 11.84RR34 pKa = 11.84RR35 pKa = 11.84AKK37 pKa = 9.79GRR39 pKa = 11.84KK40 pKa = 8.85RR41 pKa = 11.84LSAA44 pKa = 3.96
MM1 pKa = 7.35KK2 pKa = 9.43RR3 pKa = 11.84TYY5 pKa = 10.07QPSKK9 pKa = 9.07IRR11 pKa = 11.84RR12 pKa = 11.84ARR14 pKa = 11.84THH16 pKa = 5.96GFRR19 pKa = 11.84ARR21 pKa = 11.84MATPGGRR28 pKa = 11.84AILRR32 pKa = 11.84RR33 pKa = 11.84RR34 pKa = 11.84RR35 pKa = 11.84AKK37 pKa = 9.79GRR39 pKa = 11.84KK40 pKa = 8.85RR41 pKa = 11.84LSAA44 pKa = 3.96
Molecular weight: 5.18 kDa
Isoelectric point according different methods:
Peptides (in silico digests for buttom-up proteomics)
Below you can find in silico digests of the whole proteome with Trypsin, Chymotrypsin, Trypsin+LysC, LysN, ArgC proteases suitable for different mass spec machines.| Try ESI |
 |
|---|
| ChTry ESI |
|
|---|
| ArgC ESI |
|
|---|
| LysN ESI |
|
|---|
| TryLysC ESI |
|
|---|
| Try MALDI |
|
|---|
| ChTry MALDI |
|
|---|
| ArgC MALDI |
|
|---|
| LysN MALDI |
|
|---|
| TryLysC MALDI |
|
|---|
| Try LTQ |
|
|---|
| ChTry LTQ |
|
|---|
| ArgC LTQ |
|
|---|
| LysN LTQ |
|
|---|
| TryLysC LTQ |
|
|---|
| Try MSlow |
|
|---|
| ChTry MSlow |
|
|---|
| ArgC MSlow |
|
|---|
| LysN MSlow |
|
|---|
| TryLysC MSlow |
|
|---|
| Try MShigh |
|
|---|
| ChTry MShigh |
|
|---|
| ArgC MShigh |
|
|---|
| LysN MShigh |
|
|---|
| TryLysC MShigh |
|
|---|
General Statistics
Number of major isoforms |
Number of additional isoforms |
Number of all proteins |
Number of amino acids |
Min. Seq. Length |
Max. Seq. Length |
Avg. Seq. Length |
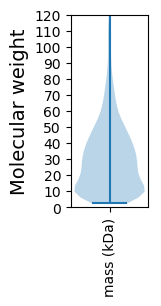
Avg. Mol. Weight |
|---|---|---|---|---|---|---|---|
0 |
982839 |
20 |
3671 |
298.6 |
32.59 |
Amino acid frequency
Ala |
Cys |
Asp |
Glu |
Phe |
Gly |
His |
Ile |
Lys |
Leu |
|---|---|---|---|---|---|---|---|---|---|
11.187 ± 0.063 | 1.629 ± 0.023 |
5.072 ± 0.043 | 5.664 ± 0.043 |
3.75 ± 0.033 | 8.183 ± 0.043 |
2.234 ± 0.021 | 4.743 ± 0.04 |
4.117 ± 0.046 | 10.623 ± 0.069 |
Met |
Asn |
Gln |
Pro |
Arg |
Ser |
Thr |
Val |
Trp |
Tyr |
|---|---|---|---|---|---|---|---|---|---|
2.906 ± 0.025 | 3.105 ± 0.032 |
5.185 ± 0.037 | 3.655 ± 0.032 |
6.273 ± 0.054 | 5.808 ± 0.038 |
5.085 ± 0.052 | 7.081 ± 0.04 |
1.24 ± 0.018 | 2.462 ± 0.027 |
Most of the basic statistics you can see at this page can be downloaded from this CSV file
See this proteome in:

Proteome-pI is available under Creative Commons Attribution-NoDerivs license, for more details see here
| Reference: Kozlowski LP. Proteome-pI 2.0: Proteome Isoelectric Point Database Update. Nucleic Acids Res. 2021, doi: 10.1093/nar/gkab944 | Contact: Lukasz P. Kozlowski |