Gluconobacter sp. DsW_058
Taxonomy: cellular organisms; Bacteria; Proteobacteria; Alphaproteobacteria; Rhodospirillales; Acetobacteraceae; Gluconobacter; unclassified Gluconobacter
Average proteome isoelectric point is 6.52
Get precalculated fractions of proteins
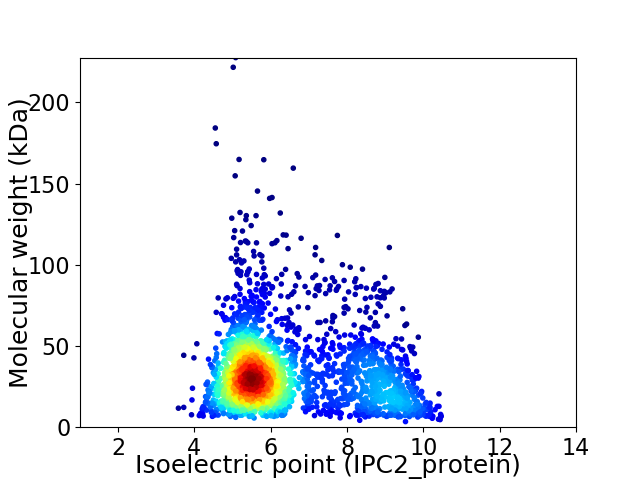
Virtual 2D-PAGE plot for 2448 proteins (isoelectric point calculated using IPC2_protein)
Get csv file with sequences according to given criteria:
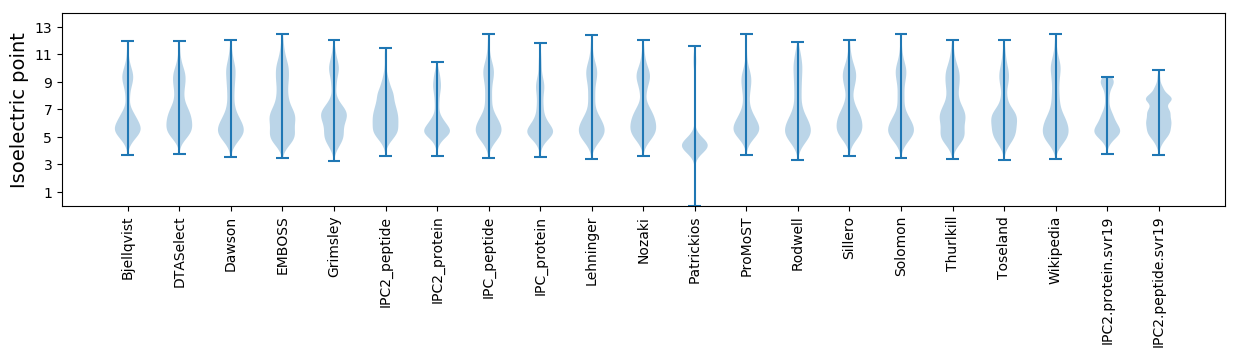
* You can choose from 21 different methods for calculating isoelectric point
Summary statistics related to proteome-wise predictions
Protein with the lowest isoelectric point:
>tr|A0A252BPF8|A0A252BPF8_9PROT Pyrroloquinoline-quinone synthase OS=Gluconobacter sp. DsW_058 OX=1511210 GN=pqqC PE=3 SV=1
MM1 pKa = 7.82SIINSLNTAVSGLNSQSHH19 pKa = 6.18AFSDD23 pKa = 4.26LSNNIANSQTTGYY36 pKa = 10.07KK37 pKa = 10.3AATTSFADD45 pKa = 3.64YY46 pKa = 9.25VTSNDD51 pKa = 3.53LASDD55 pKa = 4.37GEE57 pKa = 4.43SLSDD61 pKa = 3.54SVAATTRR68 pKa = 11.84QHH70 pKa = 6.29TDD72 pKa = 2.65NQGMVVSSTNTLALAISGNGFFNVVQPTGSTTSSTAPTFSSQQFYY117 pKa = 9.49TRR119 pKa = 11.84NGDD122 pKa = 3.74FSQNNQGYY130 pKa = 8.85LVNTSGYY137 pKa = 8.75YY138 pKa = 10.2LEE140 pKa = 5.6GYY142 pKa = 9.3QVGSEE147 pKa = 4.28GALSSTLSPIKK158 pKa = 10.46ISDD161 pKa = 3.66SVAFQPTKK169 pKa = 9.97STTVSLSAAIGSTSGAEE186 pKa = 4.13GTNTSTATAYY196 pKa = 10.24DD197 pKa = 3.74SKK199 pKa = 11.83GNAQEE204 pKa = 5.22VSLNWKK210 pKa = 9.79QSSTDD215 pKa = 3.5PLVWTVSNSADD226 pKa = 3.33SSNSATVKK234 pKa = 10.45FNSDD238 pKa = 2.67GSLASVNGASQSTGSAATFSYY259 pKa = 10.26TGLPQDD265 pKa = 3.36MTVNLGTIGSTSGVSLATDD284 pKa = 3.57SSNYY288 pKa = 7.99STNPTMTTDD297 pKa = 3.31SVTSGTFTGLSMQSDD312 pKa = 4.64GSVMATFDD320 pKa = 3.57NGLSQLLAKK329 pKa = 10.27IPLSTFADD337 pKa = 3.94PNGLSAQNGQAYY349 pKa = 6.92TATASSGAPTVNAVNTNGAGTLSTSSTEE377 pKa = 4.18SSTTDD382 pKa = 3.25LTSDD386 pKa = 3.46LTKK389 pKa = 10.96LIVAQQAYY397 pKa = 9.02GANTKK402 pKa = 9.86IVTTANQLLQTTLAMIQQ419 pKa = 3.18
MM1 pKa = 7.82SIINSLNTAVSGLNSQSHH19 pKa = 6.18AFSDD23 pKa = 4.26LSNNIANSQTTGYY36 pKa = 10.07KK37 pKa = 10.3AATTSFADD45 pKa = 3.64YY46 pKa = 9.25VTSNDD51 pKa = 3.53LASDD55 pKa = 4.37GEE57 pKa = 4.43SLSDD61 pKa = 3.54SVAATTRR68 pKa = 11.84QHH70 pKa = 6.29TDD72 pKa = 2.65NQGMVVSSTNTLALAISGNGFFNVVQPTGSTTSSTAPTFSSQQFYY117 pKa = 9.49TRR119 pKa = 11.84NGDD122 pKa = 3.74FSQNNQGYY130 pKa = 8.85LVNTSGYY137 pKa = 8.75YY138 pKa = 10.2LEE140 pKa = 5.6GYY142 pKa = 9.3QVGSEE147 pKa = 4.28GALSSTLSPIKK158 pKa = 10.46ISDD161 pKa = 3.66SVAFQPTKK169 pKa = 9.97STTVSLSAAIGSTSGAEE186 pKa = 4.13GTNTSTATAYY196 pKa = 10.24DD197 pKa = 3.74SKK199 pKa = 11.83GNAQEE204 pKa = 5.22VSLNWKK210 pKa = 9.79QSSTDD215 pKa = 3.5PLVWTVSNSADD226 pKa = 3.33SSNSATVKK234 pKa = 10.45FNSDD238 pKa = 2.67GSLASVNGASQSTGSAATFSYY259 pKa = 10.26TGLPQDD265 pKa = 3.36MTVNLGTIGSTSGVSLATDD284 pKa = 3.57SSNYY288 pKa = 7.99STNPTMTTDD297 pKa = 3.31SVTSGTFTGLSMQSDD312 pKa = 4.64GSVMATFDD320 pKa = 3.57NGLSQLLAKK329 pKa = 10.27IPLSTFADD337 pKa = 3.94PNGLSAQNGQAYY349 pKa = 6.92TATASSGAPTVNAVNTNGAGTLSTSSTEE377 pKa = 4.18SSTTDD382 pKa = 3.25LTSDD386 pKa = 3.46LTKK389 pKa = 10.96LIVAQQAYY397 pKa = 9.02GANTKK402 pKa = 9.86IVTTANQLLQTTLAMIQQ419 pKa = 3.18
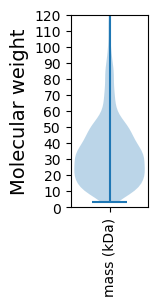
Molecular weight: 42.69 kDa
Isoelectric point according different methods:
Protein with the highest isoelectric point:
>tr|A0A252BPG3|A0A252BPG3_9PROT Cys-tRNA(Pro)/Cys-tRNA(Cys) deacylase OS=Gluconobacter sp. DsW_058 OX=1511210 GN=HK24_06550 PE=3 SV=1
MM1 pKa = 7.78RR2 pKa = 11.84ALLVCLFLTVTTLMTPDD19 pKa = 4.26ASAQGLEE26 pKa = 4.06SGMLSVRR33 pKa = 11.84MRR35 pKa = 11.84LAEE38 pKa = 4.28DD39 pKa = 3.29AGMSGVDD46 pKa = 3.48RR47 pKa = 11.84RR48 pKa = 11.84LIVCRR53 pKa = 11.84INPRR57 pKa = 11.84LLHH60 pKa = 5.52TVWVPNVKK68 pKa = 10.01EE69 pKa = 3.81PRR71 pKa = 11.84QPQVCTGGANRR82 pKa = 11.84LGAGYY87 pKa = 10.33VRR89 pKa = 11.84YY90 pKa = 9.89LSTSRR95 pKa = 11.84VSKK98 pKa = 10.84AEE100 pKa = 3.75KK101 pKa = 9.61PLRR104 pKa = 11.84GG105 pKa = 3.48
MM1 pKa = 7.78RR2 pKa = 11.84ALLVCLFLTVTTLMTPDD19 pKa = 4.26ASAQGLEE26 pKa = 4.06SGMLSVRR33 pKa = 11.84MRR35 pKa = 11.84LAEE38 pKa = 4.28DD39 pKa = 3.29AGMSGVDD46 pKa = 3.48RR47 pKa = 11.84RR48 pKa = 11.84LIVCRR53 pKa = 11.84INPRR57 pKa = 11.84LLHH60 pKa = 5.52TVWVPNVKK68 pKa = 10.01EE69 pKa = 3.81PRR71 pKa = 11.84QPQVCTGGANRR82 pKa = 11.84LGAGYY87 pKa = 10.33VRR89 pKa = 11.84YY90 pKa = 9.89LSTSRR95 pKa = 11.84VSKK98 pKa = 10.84AEE100 pKa = 3.75KK101 pKa = 9.61PLRR104 pKa = 11.84GG105 pKa = 3.48
Molecular weight: 11.51 kDa
Isoelectric point according different methods:
Peptides (in silico digests for buttom-up proteomics)
Below you can find in silico digests of the whole proteome with Trypsin, Chymotrypsin, Trypsin+LysC, LysN, ArgC proteases suitable for different mass spec machines.| Try ESI |
 |
|---|
| ChTry ESI |
|
|---|
| ArgC ESI |
|
|---|
| LysN ESI |
|
|---|
| TryLysC ESI |
|
|---|
| Try MALDI |
|
|---|
| ChTry MALDI |
|
|---|
| ArgC MALDI |
|
|---|
| LysN MALDI |
|
|---|
| TryLysC MALDI |
|
|---|
| Try LTQ |
|
|---|
| ChTry LTQ |
|
|---|
| ArgC LTQ |
|
|---|
| LysN LTQ |
|
|---|
| TryLysC LTQ |
|
|---|
| Try MSlow |
|
|---|
| ChTry MSlow |
|
|---|
| ArgC MSlow |
|
|---|
| LysN MSlow |
|
|---|
| TryLysC MSlow |
|
|---|
| Try MShigh |
|
|---|
| ChTry MShigh |
|
|---|
| ArgC MShigh |
|
|---|
| LysN MShigh |
|
|---|
| TryLysC MShigh |
|
|---|
General Statistics
Number of major isoforms |
Number of additional isoforms |
Number of all proteins |
Number of amino acids |
Min. Seq. Length |
Max. Seq. Length |
Avg. Seq. Length |
Avg. Mol. Weight |
|---|---|---|---|---|---|---|---|
0 |
805449 |
31 |
2117 |
329.0 |
35.81 |
Amino acid frequency
Ala |
Cys |
Asp |
Glu |
Phe |
Gly |
His |
Ile |
Lys |
Leu |
|---|---|---|---|---|---|---|---|---|---|
11.081 ± 0.057 | 0.946 ± 0.015 |
5.558 ± 0.038 | 5.233 ± 0.044 |
3.566 ± 0.03 | 8.366 ± 0.047 |
2.453 ± 0.022 | 5.017 ± 0.034 |
3.189 ± 0.036 | 10.444 ± 0.061 |
Met |
Asn |
Gln |
Pro |
Arg |
Ser |
Thr |
Val |
Trp |
Tyr |
|---|---|---|---|---|---|---|---|---|---|
2.492 ± 0.018 | 2.928 ± 0.034 |
5.404 ± 0.038 | 3.665 ± 0.03 |
6.638 ± 0.044 | 6.285 ± 0.04 |
5.908 ± 0.035 | 7.121 ± 0.039 |
1.388 ± 0.02 | 2.318 ± 0.032 |
Most of the basic statistics you can see at this page can be downloaded from this CSV file
See this proteome in:

Proteome-pI is available under Creative Commons Attribution-NoDerivs license, for more details see here
| Reference: Kozlowski LP. Proteome-pI 2.0: Proteome Isoelectric Point Database Update. Nucleic Acids Res. 2021, doi: 10.1093/nar/gkab944 | Contact: Lukasz P. Kozlowski |