Streptococcus phage Javan94
Taxonomy: Viruses; Duplodnaviria; Heunggongvirae; Uroviricota; Caudoviricetes; Caudovirales; Siphoviridae; unclassified Siphoviridae
Average proteome isoelectric point is 6.05
Get precalculated fractions of proteins
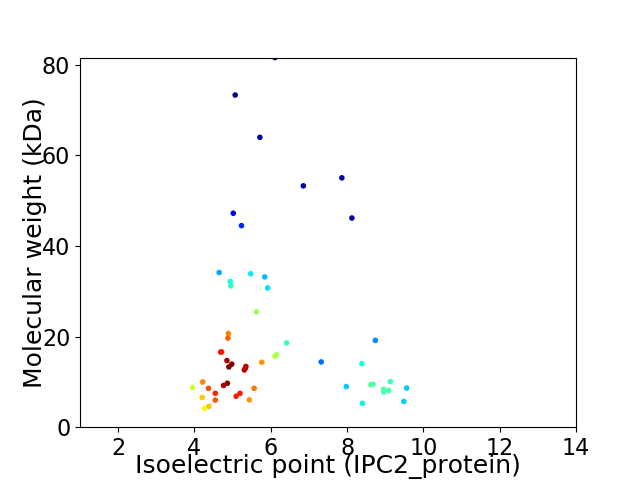
Virtual 2D-PAGE plot for 56 proteins (isoelectric point calculated using IPC2_protein)
Get csv file with sequences according to given criteria:
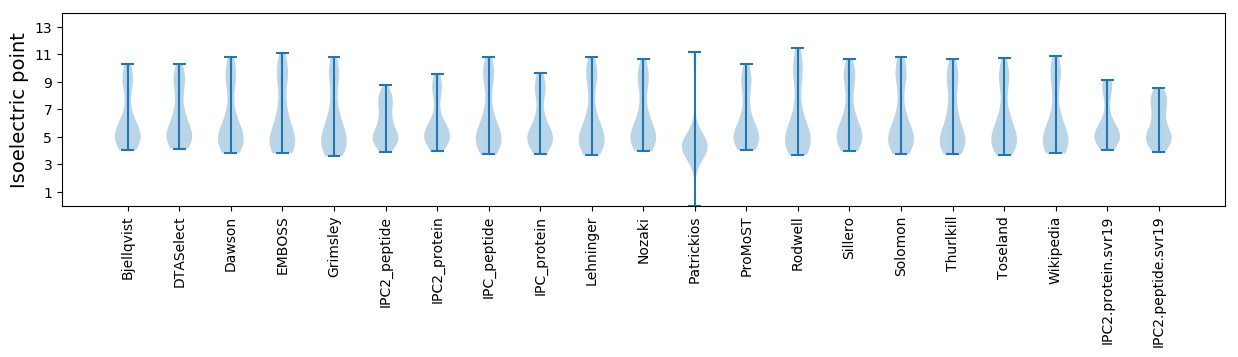
* You can choose from 21 different methods for calculating isoelectric point
Summary statistics related to proteome-wise predictions
Protein with the lowest isoelectric point:
>tr|A0A4D6BFS8|A0A4D6BFS8_9CAUD Uncharacterized protein OS=Streptococcus phage Javan94 OX=2548317 GN=Javan94_0053 PE=4 SV=1
MM1 pKa = 7.55TSLCFAEE8 pKa = 5.35DD9 pKa = 4.09SYY11 pKa = 11.88FLSSSAHH18 pKa = 6.35CLFDD22 pKa = 4.82LQTTYY27 pKa = 8.9QTSAYY32 pKa = 8.06YY33 pKa = 8.47TANVV37 pKa = 3.33
MM1 pKa = 7.55TSLCFAEE8 pKa = 5.35DD9 pKa = 4.09SYY11 pKa = 11.88FLSSSAHH18 pKa = 6.35CLFDD22 pKa = 4.82LQTTYY27 pKa = 8.9QTSAYY32 pKa = 8.06YY33 pKa = 8.47TANVV37 pKa = 3.33
Molecular weight: 4.18 kDa
Isoelectric point according different methods:
Protein with the highest isoelectric point:
>tr|A0A4D6BFQ4|A0A4D6BFQ4_9CAUD Uncharacterized protein OS=Streptococcus phage Javan94 OX=2548317 GN=Javan94_0023 PE=4 SV=1
MM1 pKa = 7.36TKK3 pKa = 7.85QHH5 pKa = 6.91RR6 pKa = 11.84EE7 pKa = 3.47TLIWYY12 pKa = 7.66RR13 pKa = 11.84ASHH16 pKa = 5.37QEE18 pKa = 4.01RR19 pKa = 11.84EE20 pKa = 4.04KK21 pKa = 11.28LLDD24 pKa = 3.94FGLVDD29 pKa = 3.68KK30 pKa = 10.91SQYY33 pKa = 8.62VTLLRR38 pKa = 11.84QLRR41 pKa = 11.84KK42 pKa = 9.91KK43 pKa = 10.48YY44 pKa = 10.73AII46 pKa = 4.1
MM1 pKa = 7.36TKK3 pKa = 7.85QHH5 pKa = 6.91RR6 pKa = 11.84EE7 pKa = 3.47TLIWYY12 pKa = 7.66RR13 pKa = 11.84ASHH16 pKa = 5.37QEE18 pKa = 4.01RR19 pKa = 11.84EE20 pKa = 4.04KK21 pKa = 11.28LLDD24 pKa = 3.94FGLVDD29 pKa = 3.68KK30 pKa = 10.91SQYY33 pKa = 8.62VTLLRR38 pKa = 11.84QLRR41 pKa = 11.84KK42 pKa = 9.91KK43 pKa = 10.48YY44 pKa = 10.73AII46 pKa = 4.1
Molecular weight: 5.69 kDa
Isoelectric point according different methods:
Peptides (in silico digests for buttom-up proteomics)
Below you can find in silico digests of the whole proteome with Trypsin, Chymotrypsin, Trypsin+LysC, LysN, ArgC proteases suitable for different mass spec machines.| Try ESI |
 |
|---|
| ChTry ESI |
|
|---|
| ArgC ESI |
|
|---|
| LysN ESI |
|
|---|
| TryLysC ESI |
|
|---|
| Try MALDI |
|
|---|
| ChTry MALDI |
|
|---|
| ArgC MALDI |
|
|---|
| LysN MALDI |
|
|---|
| TryLysC MALDI |
|
|---|
| Try LTQ |
|
|---|
| ChTry LTQ |
|
|---|
| ArgC LTQ |
|
|---|
| LysN LTQ |
|
|---|
| TryLysC LTQ |
|
|---|
| Try MSlow |
|
|---|
| ChTry MSlow |
|
|---|
| ArgC MSlow |
|
|---|
| LysN MSlow |
|
|---|
| TryLysC MSlow |
|
|---|
| Try MShigh |
|
|---|
| ChTry MShigh |
|
|---|
| ArgC MShigh |
|
|---|
| LysN MShigh |
|
|---|
| TryLysC MShigh |
|
|---|
General Statistics
Number of major isoforms |
Number of additional isoforms |
Number of all proteins |
Number of amino acids |
Min. Seq. Length |
Max. Seq. Length |
Avg. Seq. Length |
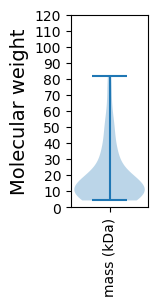
Avg. Mol. Weight |
|---|---|---|---|---|---|---|---|
0 |
10112 |
37 |
787 |
180.6 |
20.32 |
Amino acid frequency
Ala |
Cys |
Asp |
Glu |
Phe |
Gly |
His |
Ile |
Lys |
Leu |
|---|---|---|---|---|---|---|---|---|---|
6.903 ± 0.594 | 0.702 ± 0.112 |
6.646 ± 0.337 | 7.427 ± 0.591 |
4.114 ± 0.247 | 6.942 ± 0.624 |
1.404 ± 0.15 | 6.883 ± 0.285 |
8.554 ± 0.446 | 8.455 ± 0.323 |
Met |
Asn |
Gln |
Pro |
Arg |
Ser |
Thr |
Val |
Trp |
Tyr |
|---|---|---|---|---|---|---|---|---|---|
2.65 ± 0.179 | 5.182 ± 0.258 |
2.888 ± 0.349 | 4.074 ± 0.256 |
3.847 ± 0.366 | 6.398 ± 0.554 |
5.914 ± 0.241 | 6.072 ± 0.24 |
1.157 ± 0.121 | 3.788 ± 0.264 |
Most of the basic statistics you can see at this page can be downloaded from this CSV file
See this proteome in:

Proteome-pI is available under Creative Commons Attribution-NoDerivs license, for more details see here
| Reference: Kozlowski LP. Proteome-pI 2.0: Proteome Isoelectric Point Database Update. Nucleic Acids Res. 2021, doi: 10.1093/nar/gkab944 | Contact: Lukasz P. Kozlowski |