Niastella vici
Taxonomy: cellular organisms; Bacteria; FCB group; Bacteroidetes/Chlorobi group; Bacteroidetes; Chitinophagia; Chitinophagales; Chitinophagaceae; Niastella
Average proteome isoelectric point is 7.08
Get precalculated fractions of proteins
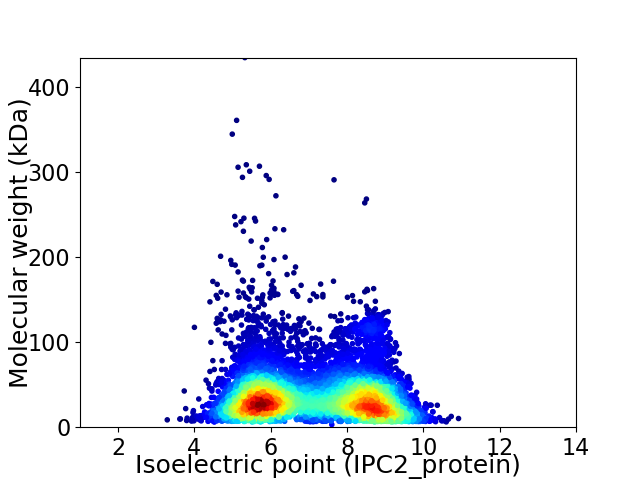
Virtual 2D-PAGE plot for 7808 proteins (isoelectric point calculated using IPC2_protein)
Get csv file with sequences according to given criteria:
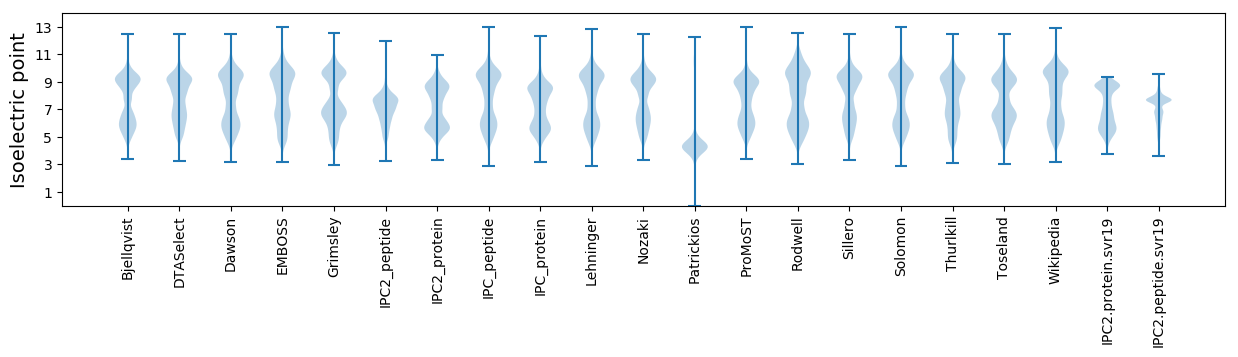
* You can choose from 21 different methods for calculating isoelectric point
Summary statistics related to proteome-wise predictions
Protein with the lowest isoelectric point:
>tr|A0A1V9G7W4|A0A1V9G7W4_9BACT Uncharacterized protein OS=Niastella vici OX=1703345 GN=A3860_13885 PE=4 SV=1
MM1 pKa = 7.66NILINQQSRR10 pKa = 11.84DD11 pKa = 3.7IPDD14 pKa = 3.64SCSLEE19 pKa = 3.92QLLTQVLGIPVAGLAVAVDD38 pKa = 3.57QTVIPSTEE46 pKa = 3.42WPAYY50 pKa = 7.21MLCEE54 pKa = 4.6ADD56 pKa = 3.5NVMLIRR62 pKa = 11.84ATQGGG67 pKa = 3.72
MM1 pKa = 7.66NILINQQSRR10 pKa = 11.84DD11 pKa = 3.7IPDD14 pKa = 3.64SCSLEE19 pKa = 3.92QLLTQVLGIPVAGLAVAVDD38 pKa = 3.57QTVIPSTEE46 pKa = 3.42WPAYY50 pKa = 7.21MLCEE54 pKa = 4.6ADD56 pKa = 3.5NVMLIRR62 pKa = 11.84ATQGGG67 pKa = 3.72
Molecular weight: 7.21 kDa
Isoelectric point according different methods:
Protein with the highest isoelectric point:
>tr|A0A1V9G8Z4|A0A1V9G8Z4_9BACT Uncharacterized protein OS=Niastella vici OX=1703345 GN=A3860_01245 PE=4 SV=1
MM1 pKa = 7.45TGTMPLKK8 pKa = 10.48LYY10 pKa = 10.99SPGGRR15 pKa = 11.84LNWLMRR21 pKa = 11.84VPRR24 pKa = 11.84KK25 pKa = 10.14RR26 pKa = 11.84GTDD29 pKa = 3.43VEE31 pKa = 4.38NEE33 pKa = 4.3CIFFISATIFNRR45 pKa = 11.84EE46 pKa = 3.88QVSGVTTSKK55 pKa = 9.84TIRR58 pKa = 11.84CLLRR62 pKa = 11.84TGFYY66 pKa = 10.31HH67 pKa = 6.97IRR69 pKa = 11.84SS70 pKa = 3.79
MM1 pKa = 7.45TGTMPLKK8 pKa = 10.48LYY10 pKa = 10.99SPGGRR15 pKa = 11.84LNWLMRR21 pKa = 11.84VPRR24 pKa = 11.84KK25 pKa = 10.14RR26 pKa = 11.84GTDD29 pKa = 3.43VEE31 pKa = 4.38NEE33 pKa = 4.3CIFFISATIFNRR45 pKa = 11.84EE46 pKa = 3.88QVSGVTTSKK55 pKa = 9.84TIRR58 pKa = 11.84CLLRR62 pKa = 11.84TGFYY66 pKa = 10.31HH67 pKa = 6.97IRR69 pKa = 11.84SS70 pKa = 3.79
Molecular weight: 8.05 kDa
Isoelectric point according different methods:
Peptides (in silico digests for buttom-up proteomics)
Below you can find in silico digests of the whole proteome with Trypsin, Chymotrypsin, Trypsin+LysC, LysN, ArgC proteases suitable for different mass spec machines.| Try ESI |
 |
|---|
| ChTry ESI |
|
|---|
| ArgC ESI |
|
|---|
| LysN ESI |
|
|---|
| TryLysC ESI |
|
|---|
| Try MALDI |
|
|---|
| ChTry MALDI |
|
|---|
| ArgC MALDI |
|
|---|
| LysN MALDI |
|
|---|
| TryLysC MALDI |
|
|---|
| Try LTQ |
|
|---|
| ChTry LTQ |
|
|---|
| ArgC LTQ |
|
|---|
| LysN LTQ |
|
|---|
| TryLysC LTQ |
|
|---|
| Try MSlow |
|
|---|
| ChTry MSlow |
|
|---|
| ArgC MSlow |
|
|---|
| LysN MSlow |
|
|---|
| TryLysC MSlow |
|
|---|
| Try MShigh |
|
|---|
| ChTry MShigh |
|
|---|
| ArgC MShigh |
|
|---|
| LysN MShigh |
|
|---|
| TryLysC MShigh |
|
|---|
General Statistics
Number of major isoforms |
Number of additional isoforms |
Number of all proteins |
Number of amino acids |
Min. Seq. Length |
Max. Seq. Length |
Avg. Seq. Length |
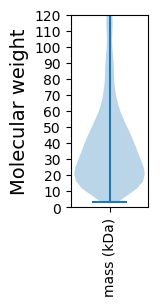
Avg. Mol. Weight |
|---|---|---|---|---|---|---|---|
0 |
2869664 |
26 |
4088 |
367.5 |
41.18 |
Amino acid frequency
Ala |
Cys |
Asp |
Glu |
Phe |
Gly |
His |
Ile |
Lys |
Leu |
|---|---|---|---|---|---|---|---|---|---|
7.635 ± 0.029 | 0.905 ± 0.01 |
5.061 ± 0.019 | 5.21 ± 0.032 |
4.741 ± 0.018 | 6.981 ± 0.031 |
1.893 ± 0.014 | 6.832 ± 0.024 |
6.504 ± 0.03 | 9.221 ± 0.035 |
Met |
Asn |
Gln |
Pro |
Arg |
Ser |
Thr |
Val |
Trp |
Tyr |
|---|---|---|---|---|---|---|---|---|---|
2.265 ± 0.012 | 5.786 ± 0.028 |
4.075 ± 0.016 | 4.015 ± 0.018 |
4.169 ± 0.019 | 6.237 ± 0.028 |
6.326 ± 0.037 | 6.448 ± 0.019 |
1.402 ± 0.013 | 4.293 ± 0.021 |
Most of the basic statistics you can see at this page can be downloaded from this CSV file
See this proteome in:

Proteome-pI is available under Creative Commons Attribution-NoDerivs license, for more details see here
| Reference: Kozlowski LP. Proteome-pI 2.0: Proteome Isoelectric Point Database Update. Nucleic Acids Res. 2021, doi: 10.1093/nar/gkab944 | Contact: Lukasz P. Kozlowski |