Jonquetella anthropi DSM 22815
Taxonomy: cellular organisms; Bacteria; Synergistetes; Synergistia; Synergistales; Synergistaceae; Jonquetella; Jonquetella anthropi
Average proteome isoelectric point is 6.58
Get precalculated fractions of proteins
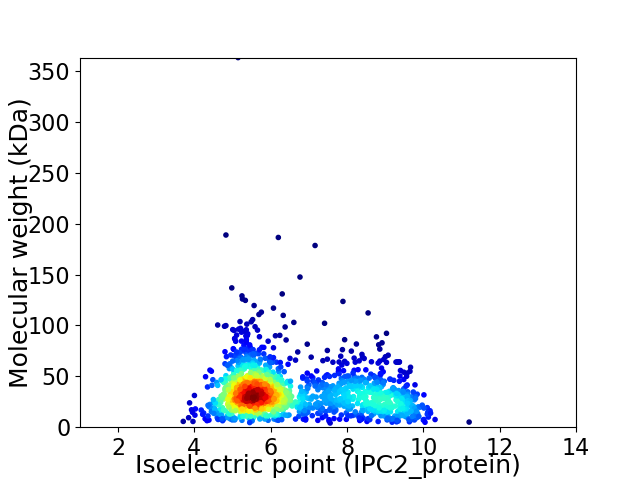
Virtual 2D-PAGE plot for 1508 proteins (isoelectric point calculated using IPC2_protein)
Get csv file with sequences according to given criteria:
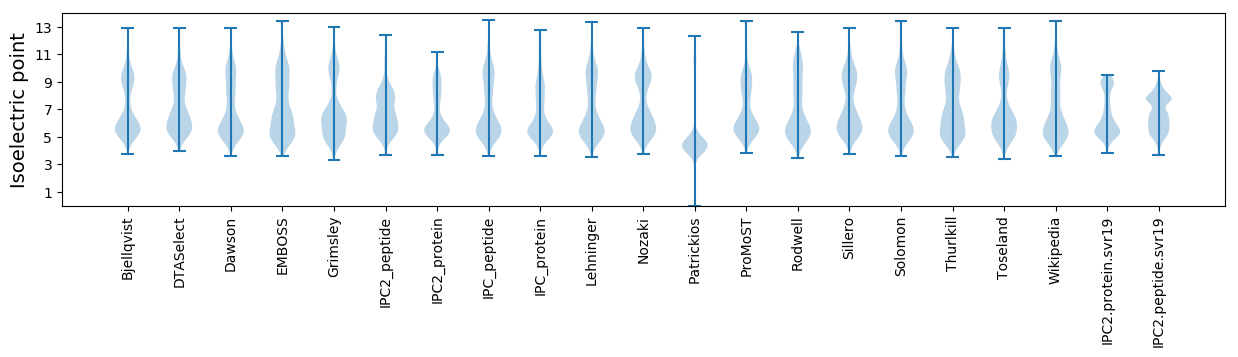
* You can choose from 21 different methods for calculating isoelectric point
Summary statistics related to proteome-wise predictions
Protein with the lowest isoelectric point:
>tr|H0UJV2|H0UJV2_9BACT N6-adenine-specific methylase OS=Jonquetella anthropi DSM 22815 OX=885272 GN=JonanDRAFT_0558 PE=4 SV=1
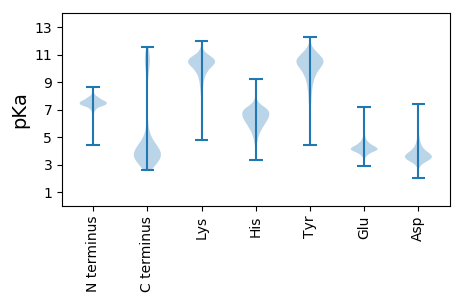
MM1 pKa = 7.51KK2 pKa = 10.22KK3 pKa = 10.16YY4 pKa = 10.62VCTVCGFVYY13 pKa = 10.33DD14 pKa = 4.61PEE16 pKa = 5.31VGDD19 pKa = 4.46PDD21 pKa = 4.6SGIAPGTAFEE31 pKa = 5.97DD32 pKa = 4.28IPDD35 pKa = 3.65DD36 pKa = 4.04WVCPEE41 pKa = 4.51CGVGKK46 pKa = 10.48DD47 pKa = 3.4MFEE50 pKa = 4.18EE51 pKa = 4.25QQ52 pKa = 3.95
MM1 pKa = 7.51KK2 pKa = 10.22KK3 pKa = 10.16YY4 pKa = 10.62VCTVCGFVYY13 pKa = 10.33DD14 pKa = 4.61PEE16 pKa = 5.31VGDD19 pKa = 4.46PDD21 pKa = 4.6SGIAPGTAFEE31 pKa = 5.97DD32 pKa = 4.28IPDD35 pKa = 3.65DD36 pKa = 4.04WVCPEE41 pKa = 4.51CGVGKK46 pKa = 10.48DD47 pKa = 3.4MFEE50 pKa = 4.18EE51 pKa = 4.25QQ52 pKa = 3.95
Molecular weight: 5.69 kDa
Isoelectric point according different methods:
Protein with the highest isoelectric point:
>tr|H0UK18|H0UK18_9BACT Indolepyruvate oxidoreductase subunit IorA OS=Jonquetella anthropi DSM 22815 OX=885272 GN=JonanDRAFT_0633 PE=4 SV=1
MM1 pKa = 7.26KK2 pKa = 9.53QTFQPHH8 pKa = 4.55NRR10 pKa = 11.84PRR12 pKa = 11.84KK13 pKa = 8.75RR14 pKa = 11.84SMGFLARR21 pKa = 11.84SRR23 pKa = 11.84SVGGRR28 pKa = 11.84AVLANRR34 pKa = 11.84RR35 pKa = 11.84AKK37 pKa = 9.81GRR39 pKa = 11.84KK40 pKa = 8.69RR41 pKa = 11.84LAVV44 pKa = 3.41
MM1 pKa = 7.26KK2 pKa = 9.53QTFQPHH8 pKa = 4.55NRR10 pKa = 11.84PRR12 pKa = 11.84KK13 pKa = 8.75RR14 pKa = 11.84SMGFLARR21 pKa = 11.84SRR23 pKa = 11.84SVGGRR28 pKa = 11.84AVLANRR34 pKa = 11.84RR35 pKa = 11.84AKK37 pKa = 9.81GRR39 pKa = 11.84KK40 pKa = 8.69RR41 pKa = 11.84LAVV44 pKa = 3.41
Molecular weight: 5.05 kDa
Isoelectric point according different methods:
Peptides (in silico digests for buttom-up proteomics)
Below you can find in silico digests of the whole proteome with Trypsin, Chymotrypsin, Trypsin+LysC, LysN, ArgC proteases suitable for different mass spec machines.| Try ESI |
 |
|---|
| ChTry ESI |
|
|---|
| ArgC ESI |
|
|---|
| LysN ESI |
|
|---|
| TryLysC ESI |
|
|---|
| Try MALDI |
|
|---|
| ChTry MALDI |
|
|---|
| ArgC MALDI |
|
|---|
| LysN MALDI |
|
|---|
| TryLysC MALDI |
|
|---|
| Try LTQ |
|
|---|
| ChTry LTQ |
|
|---|
| ArgC LTQ |
|
|---|
| LysN LTQ |
|
|---|
| TryLysC LTQ |
|
|---|
| Try MSlow |
|
|---|
| ChTry MSlow |
|
|---|
| ArgC MSlow |
|
|---|
| LysN MSlow |
|
|---|
| TryLysC MSlow |
|
|---|
| Try MShigh |
|
|---|
| ChTry MShigh |
|
|---|
| ArgC MShigh |
|
|---|
| LysN MShigh |
|
|---|
| TryLysC MShigh |
|
|---|
General Statistics
Number of major isoforms |
Number of additional isoforms |
Number of all proteins |
Number of amino acids |
Min. Seq. Length |
Max. Seq. Length |
Avg. Seq. Length |
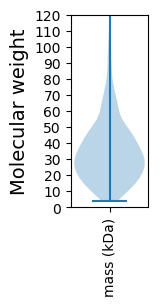
Avg. Mol. Weight |
|---|---|---|---|---|---|---|---|
0 |
500423 |
36 |
3570 |
331.8 |
36.19 |
Amino acid frequency
Ala |
Cys |
Asp |
Glu |
Phe |
Gly |
His |
Ile |
Lys |
Leu |
|---|---|---|---|---|---|---|---|---|---|
10.497 ± 0.077 | 1.477 ± 0.022 |
5.344 ± 0.048 | 6.022 ± 0.064 |
3.8 ± 0.04 | 8.58 ± 0.064 |
1.624 ± 0.025 | 4.82 ± 0.052 |
4.503 ± 0.052 | 10.735 ± 0.074 |
Met |
Asn |
Gln |
Pro |
Arg |
Ser |
Thr |
Val |
Trp |
Tyr |
|---|---|---|---|---|---|---|---|---|---|
2.551 ± 0.03 | 2.692 ± 0.041 |
4.728 ± 0.04 | 3.221 ± 0.038 |
6.363 ± 0.06 | 6.433 ± 0.045 |
4.984 ± 0.046 | 7.836 ± 0.063 |
1.408 ± 0.028 | 2.386 ± 0.032 |
Most of the basic statistics you can see at this page can be downloaded from this CSV file
See this proteome in:

Proteome-pI is available under Creative Commons Attribution-NoDerivs license, for more details see here
| Reference: Kozlowski LP. Proteome-pI 2.0: Proteome Isoelectric Point Database Update. Nucleic Acids Res. 2021, doi: 10.1093/nar/gkab944 | Contact: Lukasz P. Kozlowski |