Roseburia phage Shimadzu
Taxonomy: Viruses; Duplodnaviria; Heunggongvirae; Uroviricota; Caudoviricetes; Caudovirales; Myoviridae; unclassified Myoviridae
Average proteome isoelectric point is 6.04
Get precalculated fractions of proteins
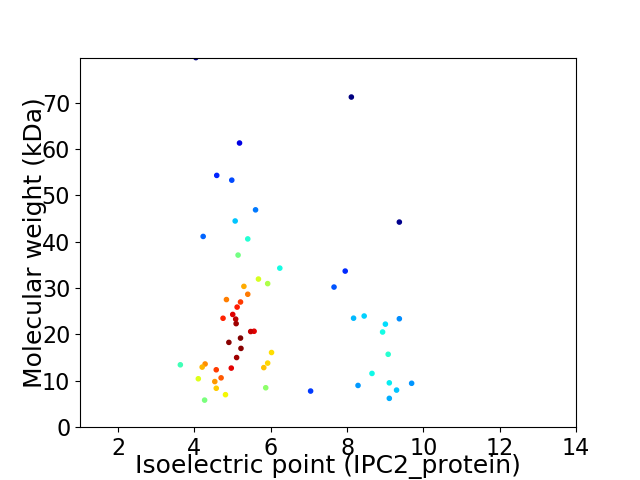
Virtual 2D-PAGE plot for 59 proteins (isoelectric point calculated using IPC2_protein)
Get csv file with sequences according to given criteria:
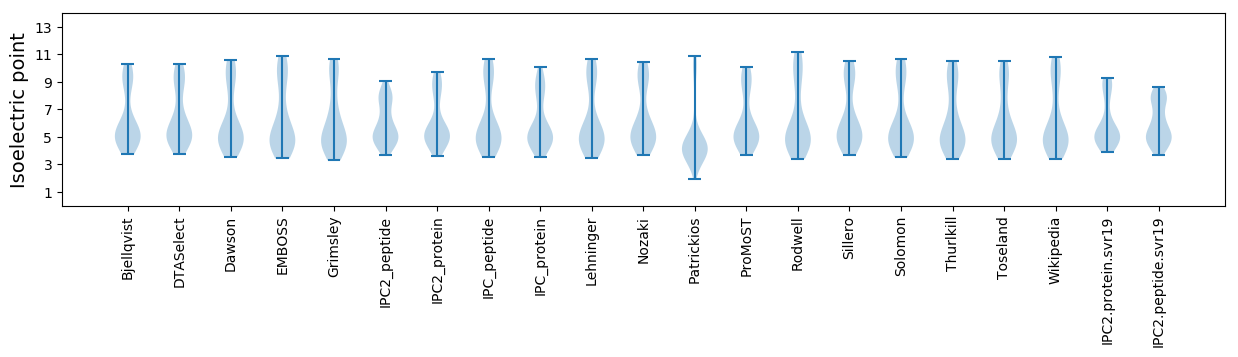
* You can choose from 21 different methods for calculating isoelectric point
Summary statistics related to proteome-wise predictions
Protein with the lowest isoelectric point:
>tr|A0A509ENL9|A0A509ENL9_9CAUD Portal OS=Roseburia phage Shimadzu OX=2570913 GN=orf04 PE=4 SV=1
MM1 pKa = 7.22YY2 pKa = 10.35NDD4 pKa = 3.89EE5 pKa = 4.74RR6 pKa = 11.84LAHH9 pKa = 6.44YY10 pKa = 9.89IIEE13 pKa = 4.31YY14 pKa = 9.95NPDD17 pKa = 3.4YY18 pKa = 11.33ADD20 pKa = 3.51VIVFEE25 pKa = 5.22GGVQLKK31 pKa = 10.69LPVVEE36 pKa = 4.36EE37 pKa = 4.64AEE39 pKa = 4.32TSEE42 pKa = 4.53TVPPWRR48 pKa = 11.84ATAA51 pKa = 3.78
MM1 pKa = 7.22YY2 pKa = 10.35NDD4 pKa = 3.89EE5 pKa = 4.74RR6 pKa = 11.84LAHH9 pKa = 6.44YY10 pKa = 9.89IIEE13 pKa = 4.31YY14 pKa = 9.95NPDD17 pKa = 3.4YY18 pKa = 11.33ADD20 pKa = 3.51VIVFEE25 pKa = 5.22GGVQLKK31 pKa = 10.69LPVVEE36 pKa = 4.36EE37 pKa = 4.64AEE39 pKa = 4.32TSEE42 pKa = 4.53TVPPWRR48 pKa = 11.84ATAA51 pKa = 3.78
Molecular weight: 5.84 kDa
Isoelectric point according different methods:
Protein with the highest isoelectric point:
>tr|A0A509ER20|A0A509ER20_9CAUD Uncharacterized protein OS=Roseburia phage Shimadzu OX=2570913 GN=orf25 PE=4 SV=1
MM1 pKa = 7.45LTRR4 pKa = 11.84ALNDD8 pKa = 3.52LKK10 pKa = 11.15NPKK13 pKa = 9.92SKK15 pKa = 9.44TGSLQIIATFTGTTGSMGFVTGQRR39 pKa = 11.84YY40 pKa = 8.3EE41 pKa = 4.19LIVRR45 pKa = 11.84YY46 pKa = 9.35IRR48 pKa = 11.84SRR50 pKa = 11.84GRR52 pKa = 11.84FEE54 pKa = 4.41VKK56 pKa = 9.57TRR58 pKa = 11.84DD59 pKa = 3.53GQLFCPYY66 pKa = 10.42QSTEE70 pKa = 3.73AFAKK74 pKa = 9.8NWSASAIQKK83 pKa = 9.46GAA85 pKa = 3.22
MM1 pKa = 7.45LTRR4 pKa = 11.84ALNDD8 pKa = 3.52LKK10 pKa = 11.15NPKK13 pKa = 9.92SKK15 pKa = 9.44TGSLQIIATFTGTTGSMGFVTGQRR39 pKa = 11.84YY40 pKa = 8.3EE41 pKa = 4.19LIVRR45 pKa = 11.84YY46 pKa = 9.35IRR48 pKa = 11.84SRR50 pKa = 11.84GRR52 pKa = 11.84FEE54 pKa = 4.41VKK56 pKa = 9.57TRR58 pKa = 11.84DD59 pKa = 3.53GQLFCPYY66 pKa = 10.42QSTEE70 pKa = 3.73AFAKK74 pKa = 9.8NWSASAIQKK83 pKa = 9.46GAA85 pKa = 3.22
Molecular weight: 9.47 kDa
Isoelectric point according different methods:
Peptides (in silico digests for buttom-up proteomics)
Below you can find in silico digests of the whole proteome with Trypsin, Chymotrypsin, Trypsin+LysC, LysN, ArgC proteases suitable for different mass spec machines.| Try ESI |
 |
|---|
| ChTry ESI |
|
|---|
| ArgC ESI |
|
|---|
| LysN ESI |
|
|---|
| TryLysC ESI |
|
|---|
| Try MALDI |
|
|---|
| ChTry MALDI |
|
|---|
| ArgC MALDI |
|
|---|
| LysN MALDI |
|
|---|
| TryLysC MALDI |
|
|---|
| Try LTQ |
|
|---|
| ChTry LTQ |
|
|---|
| ArgC LTQ |
|
|---|
| LysN LTQ |
|
|---|
| TryLysC LTQ |
|
|---|
| Try MSlow |
|
|---|
| ChTry MSlow |
|
|---|
| ArgC MSlow |
|
|---|
| LysN MSlow |
|
|---|
| TryLysC MSlow |
|
|---|
| Try MShigh |
|
|---|
| ChTry MShigh |
|
|---|
| ArgC MShigh |
|
|---|
| LysN MShigh |
|
|---|
| TryLysC MShigh |
|
|---|
General Statistics
Number of major isoforms |
Number of additional isoforms |
Number of all proteins |
Number of amino acids |
Min. Seq. Length |
Max. Seq. Length |
Avg. Seq. Length |
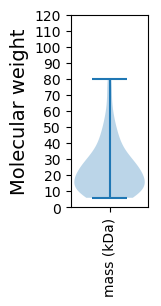
Avg. Mol. Weight |
|---|---|---|---|---|---|---|---|
0 |
12942 |
51 |
756 |
219.4 |
24.38 |
Amino acid frequency
Ala |
Cys |
Asp |
Glu |
Phe |
Gly |
His |
Ile |
Lys |
Leu |
|---|---|---|---|---|---|---|---|---|---|
9.736 ± 0.431 | 1.19 ± 0.125 |
5.795 ± 0.252 | 7.781 ± 0.365 |
3.199 ± 0.148 | 7.016 ± 0.286 |
1.429 ± 0.123 | 6.351 ± 0.269 |
6.63 ± 0.316 | 7.34 ± 0.28 |
Met |
Asn |
Gln |
Pro |
Arg |
Ser |
Thr |
Val |
Trp |
Tyr |
|---|---|---|---|---|---|---|---|---|---|
2.488 ± 0.148 | 4.142 ± 0.214 |
4.319 ± 0.207 | 4.01 ± 0.26 |
4.968 ± 0.386 | 5.764 ± 0.344 |
6.9 ± 0.273 | 5.803 ± 0.341 |
1.375 ± 0.137 | 3.763 ± 0.231 |
Most of the basic statistics you can see at this page can be downloaded from this CSV file
See this proteome in:

Proteome-pI is available under Creative Commons Attribution-NoDerivs license, for more details see here
| Reference: Kozlowski LP. Proteome-pI 2.0: Proteome Isoelectric Point Database Update. Nucleic Acids Res. 2021, doi: 10.1093/nar/gkab944 | Contact: Lukasz P. Kozlowski |