Methanothrix soehngenii (strain ATCC 5969 / DSM 3671 / JCM 10134 / NBRC 103675 / OCM 69 / GP-6) (Methanosaeta concilii)
Taxonomy: cellular organisms; Archaea; Euryarchaeota; Stenosarchaea group; Methanomicrobia; Methanosarcinales; Methanotrichaceae; Methanothrix; Methanothrix soehngenii
Average proteome isoelectric point is 6.1
Get precalculated fractions of proteins
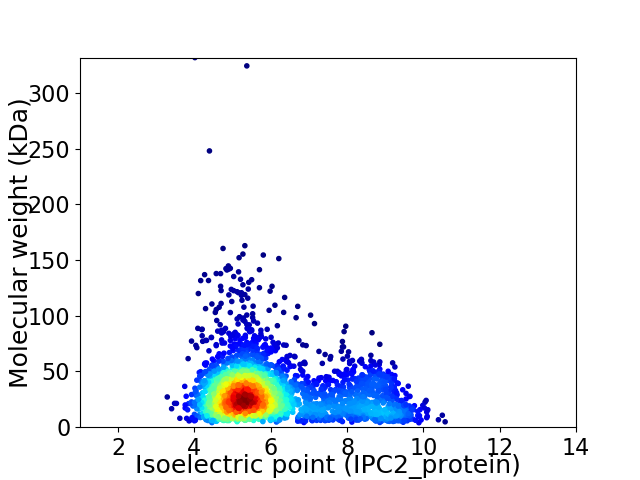
Virtual 2D-PAGE plot for 2791 proteins (isoelectric point calculated using IPC2_protein)
Get csv file with sequences according to given criteria:
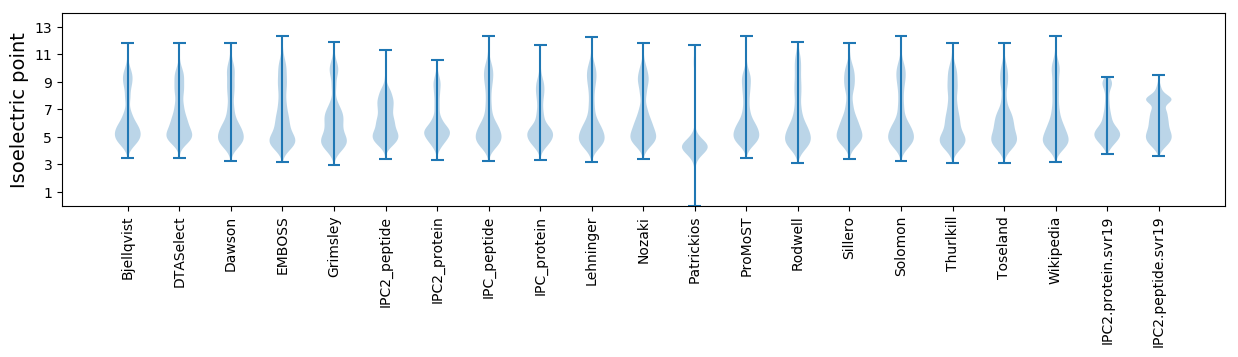
* You can choose from 21 different methods for calculating isoelectric point
Summary statistics related to proteome-wise predictions
Protein with the lowest isoelectric point:
>tr|F4BT93|F4BT93_METSG Fibronectin type-III domain-containing protein OS=Methanothrix soehngenii (strain ATCC 5969 / DSM 3671 / JCM 10134 / NBRC 103675 / OCM 69 / GP-6) OX=990316 GN=MCON_0003 PE=4 SV=1
MM1 pKa = 7.94DD2 pKa = 3.79IVSRR6 pKa = 11.84KK7 pKa = 9.97YY8 pKa = 10.89GIASLIALILIAFGFNAAGAEE29 pKa = 3.99YY30 pKa = 10.71SLGSEE35 pKa = 4.47SDD37 pKa = 4.0DD38 pKa = 2.93WWKK41 pKa = 10.7EE42 pKa = 3.77YY43 pKa = 10.22PDD45 pKa = 3.55QSTGAGGDD53 pKa = 3.39VSHH56 pKa = 7.68PDD58 pKa = 3.06WVLDD62 pKa = 3.78ALEE65 pKa = 4.61SKK67 pKa = 10.46PVLIYY72 pKa = 8.9VHH74 pKa = 6.85KK75 pKa = 10.29EE76 pKa = 3.07CDD78 pKa = 3.39YY79 pKa = 11.26CVPQTEE85 pKa = 4.36AVQKK89 pKa = 10.72IIDD92 pKa = 4.07EE93 pKa = 4.39FSGEE97 pKa = 3.78ITIFEE102 pKa = 4.65LGADD106 pKa = 3.8GSDD109 pKa = 3.46VRR111 pKa = 11.84SGEE114 pKa = 3.91ALQAYY119 pKa = 8.53DD120 pKa = 4.1PNGGLDD126 pKa = 3.4MFVPLTVILTLAPDD140 pKa = 3.62SEE142 pKa = 4.78GEE144 pKa = 4.2IVAVWHH150 pKa = 6.55SSDD153 pKa = 4.09EE154 pKa = 4.15ITGEE158 pKa = 3.69EE159 pKa = 4.33WIRR162 pKa = 11.84NYY164 pKa = 10.47VEE166 pKa = 4.94DD167 pKa = 5.78AISLYY172 pKa = 10.87DD173 pKa = 3.77EE174 pKa = 5.97NYY176 pKa = 11.01ADD178 pKa = 3.85WDD180 pKa = 3.75NN181 pKa = 3.47
MM1 pKa = 7.94DD2 pKa = 3.79IVSRR6 pKa = 11.84KK7 pKa = 9.97YY8 pKa = 10.89GIASLIALILIAFGFNAAGAEE29 pKa = 3.99YY30 pKa = 10.71SLGSEE35 pKa = 4.47SDD37 pKa = 4.0DD38 pKa = 2.93WWKK41 pKa = 10.7EE42 pKa = 3.77YY43 pKa = 10.22PDD45 pKa = 3.55QSTGAGGDD53 pKa = 3.39VSHH56 pKa = 7.68PDD58 pKa = 3.06WVLDD62 pKa = 3.78ALEE65 pKa = 4.61SKK67 pKa = 10.46PVLIYY72 pKa = 8.9VHH74 pKa = 6.85KK75 pKa = 10.29EE76 pKa = 3.07CDD78 pKa = 3.39YY79 pKa = 11.26CVPQTEE85 pKa = 4.36AVQKK89 pKa = 10.72IIDD92 pKa = 4.07EE93 pKa = 4.39FSGEE97 pKa = 3.78ITIFEE102 pKa = 4.65LGADD106 pKa = 3.8GSDD109 pKa = 3.46VRR111 pKa = 11.84SGEE114 pKa = 3.91ALQAYY119 pKa = 8.53DD120 pKa = 4.1PNGGLDD126 pKa = 3.4MFVPLTVILTLAPDD140 pKa = 3.62SEE142 pKa = 4.78GEE144 pKa = 4.2IVAVWHH150 pKa = 6.55SSDD153 pKa = 4.09EE154 pKa = 4.15ITGEE158 pKa = 3.69EE159 pKa = 4.33WIRR162 pKa = 11.84NYY164 pKa = 10.47VEE166 pKa = 4.94DD167 pKa = 5.78AISLYY172 pKa = 10.87DD173 pKa = 3.77EE174 pKa = 5.97NYY176 pKa = 11.01ADD178 pKa = 3.85WDD180 pKa = 3.75NN181 pKa = 3.47
Molecular weight: 19.95 kDa
Isoelectric point according different methods:
Protein with the highest isoelectric point:
>tr|F4BTI6|F4BTI6_METSG Type 2 DNA topoisomerase 6 subunit A OS=Methanothrix soehngenii (strain ATCC 5969 / DSM 3671 / JCM 10134 / NBRC 103675 / OCM 69 / GP-6) OX=990316 GN=top6a PE=3 SV=1
MM1 pKa = 7.4NWTPLGGDD9 pKa = 3.38YY10 pKa = 10.54RR11 pKa = 11.84RR12 pKa = 11.84QKK14 pKa = 10.63LYY16 pKa = 11.1NRR18 pKa = 11.84GILVKK23 pKa = 10.67NPRR26 pKa = 11.84ICLAISHH33 pKa = 7.35LDD35 pKa = 3.57CMDD38 pKa = 3.79NGLLRR43 pKa = 11.84NHH45 pKa = 7.02LAVAEE50 pKa = 4.36EE51 pKa = 3.83WRR53 pKa = 11.84MRR55 pKa = 11.84MVPSAHH61 pKa = 6.9CSDD64 pKa = 4.11TSPEE68 pKa = 3.91RR69 pKa = 11.84TRR71 pKa = 11.84KK72 pKa = 9.35GRR74 pKa = 11.84RR75 pKa = 11.84SRR77 pKa = 3.52
MM1 pKa = 7.4NWTPLGGDD9 pKa = 3.38YY10 pKa = 10.54RR11 pKa = 11.84RR12 pKa = 11.84QKK14 pKa = 10.63LYY16 pKa = 11.1NRR18 pKa = 11.84GILVKK23 pKa = 10.67NPRR26 pKa = 11.84ICLAISHH33 pKa = 7.35LDD35 pKa = 3.57CMDD38 pKa = 3.79NGLLRR43 pKa = 11.84NHH45 pKa = 7.02LAVAEE50 pKa = 4.36EE51 pKa = 3.83WRR53 pKa = 11.84MRR55 pKa = 11.84MVPSAHH61 pKa = 6.9CSDD64 pKa = 4.11TSPEE68 pKa = 3.91RR69 pKa = 11.84TRR71 pKa = 11.84KK72 pKa = 9.35GRR74 pKa = 11.84RR75 pKa = 11.84SRR77 pKa = 3.52
Molecular weight: 9.01 kDa
Isoelectric point according different methods:
Peptides (in silico digests for buttom-up proteomics)
Below you can find in silico digests of the whole proteome with Trypsin, Chymotrypsin, Trypsin+LysC, LysN, ArgC proteases suitable for different mass spec machines.| Try ESI |
 |
|---|
| ChTry ESI |
|
|---|
| ArgC ESI |
|
|---|
| LysN ESI |
|
|---|
| TryLysC ESI |
|
|---|
| Try MALDI |
|
|---|
| ChTry MALDI |
|
|---|
| ArgC MALDI |
|
|---|
| LysN MALDI |
|
|---|
| TryLysC MALDI |
|
|---|
| Try LTQ |
|
|---|
| ChTry LTQ |
|
|---|
| ArgC LTQ |
|
|---|
| LysN LTQ |
|
|---|
| TryLysC LTQ |
|
|---|
| Try MSlow |
|
|---|
| ChTry MSlow |
|
|---|
| ArgC MSlow |
|
|---|
| LysN MSlow |
|
|---|
| TryLysC MSlow |
|
|---|
| Try MShigh |
|
|---|
| ChTry MShigh |
|
|---|
| ArgC MShigh |
|
|---|
| LysN MShigh |
|
|---|
| TryLysC MShigh |
|
|---|
General Statistics
Number of major isoforms |
Number of additional isoforms |
Number of all proteins |
Number of amino acids |
Min. Seq. Length |
Max. Seq. Length |
Avg. Seq. Length |
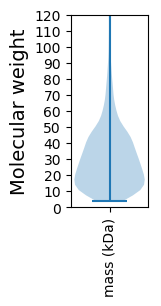
Avg. Mol. Weight |
|---|---|---|---|---|---|---|---|
0 |
821985 |
37 |
3064 |
294.5 |
32.67 |
Amino acid frequency
Ala |
Cys |
Asp |
Glu |
Phe |
Gly |
His |
Ile |
Lys |
Leu |
|---|---|---|---|---|---|---|---|---|---|
8.471 ± 0.055 | 1.301 ± 0.026 |
5.829 ± 0.039 | 7.178 ± 0.045 |
3.634 ± 0.032 | 7.683 ± 0.047 |
1.723 ± 0.022 | 7.222 ± 0.04 |
5.306 ± 0.05 | 9.877 ± 0.059 |
Met |
Asn |
Gln |
Pro |
Arg |
Ser |
Thr |
Val |
Trp |
Tyr |
|---|---|---|---|---|---|---|---|---|---|
2.859 ± 0.023 | 3.553 ± 0.036 |
4.255 ± 0.035 | 3.024 ± 0.027 |
5.903 ± 0.041 | 6.82 ± 0.047 |
4.514 ± 0.038 | 6.564 ± 0.042 |
1.156 ± 0.019 | 3.127 ± 0.03 |
Most of the basic statistics you can see at this page can be downloaded from this CSV file
See this proteome in:

Proteome-pI is available under Creative Commons Attribution-NoDerivs license, for more details see here
| Reference: Kozlowski LP. Proteome-pI 2.0: Proteome Isoelectric Point Database Update. Nucleic Acids Res. 2021, doi: 10.1093/nar/gkab944 | Contact: Lukasz P. Kozlowski |