Streptococcus satellite phage Javan343
Taxonomy: Viruses; unclassified bacterial viruses
Average proteome isoelectric point is 6.38
Get precalculated fractions of proteins
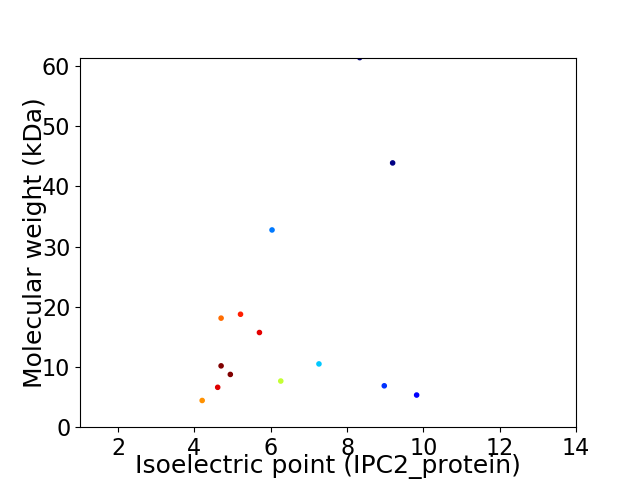
Virtual 2D-PAGE plot for 14 proteins (isoelectric point calculated using IPC2_protein)
Get csv file with sequences according to given criteria:
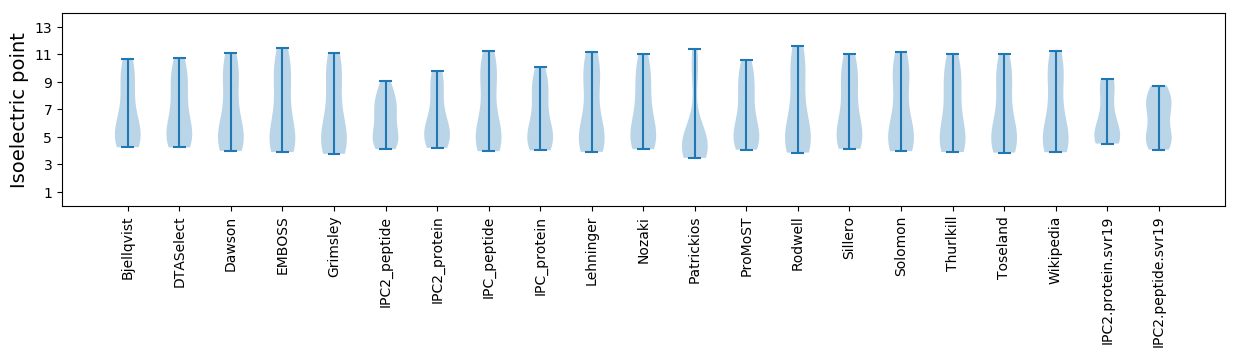
* You can choose from 21 different methods for calculating isoelectric point
Summary statistics related to proteome-wise predictions
Protein with the lowest isoelectric point:
>tr|A0A4D5ZLE1|A0A4D5ZLE1_9VIRU DNA primase OS=Streptococcus satellite phage Javan343 OX=2558651 GN=JavanS343_0008 PE=4 SV=1
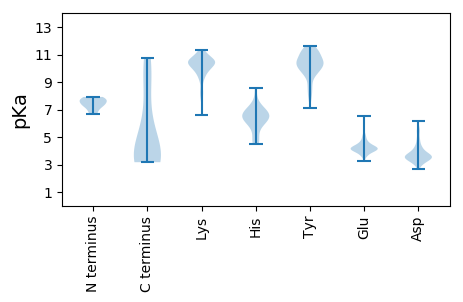
MM1 pKa = 7.86PSFDD5 pKa = 4.12EE6 pKa = 5.84LINSDD11 pKa = 4.51QEE13 pKa = 4.85FEE15 pKa = 4.71DD16 pKa = 4.36SPISLKK22 pKa = 11.05LKK24 pKa = 10.62DD25 pKa = 3.51ILKK28 pKa = 9.01QLKK31 pKa = 10.28VNTEE35 pKa = 3.84EE36 pKa = 5.24LEE38 pKa = 4.07
MM1 pKa = 7.86PSFDD5 pKa = 4.12EE6 pKa = 5.84LINSDD11 pKa = 4.51QEE13 pKa = 4.85FEE15 pKa = 4.71DD16 pKa = 4.36SPISLKK22 pKa = 11.05LKK24 pKa = 10.62DD25 pKa = 3.51ILKK28 pKa = 9.01QLKK31 pKa = 10.28VNTEE35 pKa = 3.84EE36 pKa = 5.24LEE38 pKa = 4.07
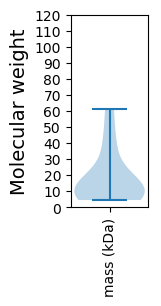
Molecular weight: 4.44 kDa
Isoelectric point according different methods:
Protein with the highest isoelectric point:
>tr|A0A4D5ZKQ3|A0A4D5ZKQ3_9VIRU HTH DNA-binding protein OS=Streptococcus satellite phage Javan343 OX=2558651 GN=JavanS343_0003 PE=4 SV=1
MM1 pKa = 7.65TEE3 pKa = 3.66PAYY6 pKa = 10.74DD7 pKa = 3.54GMKK10 pKa = 10.03LAKK13 pKa = 9.57EE14 pKa = 4.55DD15 pKa = 3.43KK16 pKa = 10.45TKK18 pKa = 11.04DD19 pKa = 3.18RR20 pKa = 11.84RR21 pKa = 11.84PKK23 pKa = 10.42LKK25 pKa = 9.87QLKK28 pKa = 8.74EE29 pKa = 3.84RR30 pKa = 11.84KK31 pKa = 8.27QLKK34 pKa = 9.73KK35 pKa = 10.38LRR37 pKa = 11.84KK38 pKa = 8.98KK39 pKa = 10.02RR40 pKa = 11.84RR41 pKa = 11.84KK42 pKa = 9.88GSS44 pKa = 3.23
MM1 pKa = 7.65TEE3 pKa = 3.66PAYY6 pKa = 10.74DD7 pKa = 3.54GMKK10 pKa = 10.03LAKK13 pKa = 9.57EE14 pKa = 4.55DD15 pKa = 3.43KK16 pKa = 10.45TKK18 pKa = 11.04DD19 pKa = 3.18RR20 pKa = 11.84RR21 pKa = 11.84PKK23 pKa = 10.42LKK25 pKa = 9.87QLKK28 pKa = 8.74EE29 pKa = 3.84RR30 pKa = 11.84KK31 pKa = 8.27QLKK34 pKa = 9.73KK35 pKa = 10.38LRR37 pKa = 11.84KK38 pKa = 8.98KK39 pKa = 10.02RR40 pKa = 11.84RR41 pKa = 11.84KK42 pKa = 9.88GSS44 pKa = 3.23
Molecular weight: 5.34 kDa
Isoelectric point according different methods:
Peptides (in silico digests for buttom-up proteomics)
Below you can find in silico digests of the whole proteome with Trypsin, Chymotrypsin, Trypsin+LysC, LysN, ArgC proteases suitable for different mass spec machines.| Try ESI |
 |
|---|
| ChTry ESI |
|
|---|
| ArgC ESI |
|
|---|
| LysN ESI |
|
|---|
| TryLysC ESI |
|
|---|
| Try MALDI |
|
|---|
| ChTry MALDI |
|
|---|
| ArgC MALDI |
|
|---|
| LysN MALDI |
|
|---|
| TryLysC MALDI |
|
|---|
| Try LTQ |
|
|---|
| ChTry LTQ |
|
|---|
| ArgC LTQ |
|
|---|
| LysN LTQ |
|
|---|
| TryLysC LTQ |
|
|---|
| Try MSlow |
|
|---|
| ChTry MSlow |
|
|---|
| ArgC MSlow |
|
|---|
| LysN MSlow |
|
|---|
| TryLysC MSlow |
|
|---|
| Try MShigh |
|
|---|
| ChTry MShigh |
|
|---|
| ArgC MShigh |
|
|---|
| LysN MShigh |
|
|---|
| TryLysC MShigh |
|
|---|
General Statistics
Number of major isoforms |
Number of additional isoforms |
Number of all proteins |
Number of amino acids |
Min. Seq. Length |
Max. Seq. Length |
Avg. Seq. Length |
Avg. Mol. Weight |
|---|---|---|---|---|---|---|---|
0 |
2186 |
38 |
536 |
156.1 |
17.93 |
Amino acid frequency
Ala |
Cys |
Asp |
Glu |
Phe |
Gly |
His |
Ile |
Lys |
Leu |
|---|---|---|---|---|---|---|---|---|---|
5.81 ± 0.369 | 0.457 ± 0.168 |
5.947 ± 0.578 | 8.371 ± 0.946 |
3.568 ± 0.513 | 5.489 ± 0.528 |
1.189 ± 0.265 | 6.679 ± 0.567 |
10.247 ± 0.84 | 10.567 ± 0.941 |
Met |
Asn |
Gln |
Pro |
Arg |
Ser |
Thr |
Val |
Trp |
Tyr |
|---|---|---|---|---|---|---|---|---|---|
2.287 ± 0.194 | 4.3 ± 0.38 |
3.431 ± 0.636 | 4.392 ± 0.394 |
4.941 ± 0.454 | 5.947 ± 0.513 |
5.764 ± 0.599 | 5.124 ± 0.557 |
0.823 ± 0.149 | 4.666 ± 0.552 |
Most of the basic statistics you can see at this page can be downloaded from this CSV file
See this proteome in:

Proteome-pI is available under Creative Commons Attribution-NoDerivs license, for more details see here
| Reference: Kozlowski LP. Proteome-pI 2.0: Proteome Isoelectric Point Database Update. Nucleic Acids Res. 2021, doi: 10.1093/nar/gkab944 | Contact: Lukasz P. Kozlowski |