Yersinia pestis
Taxonomy:
Average proteome isoelectric point is 6.54
Get precalculated fractions of proteins
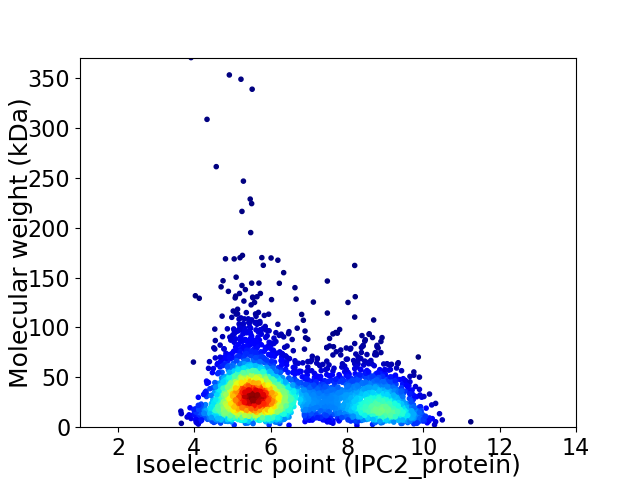
Virtual 2D-PAGE plot for 3910 proteins (isoelectric point calculated using IPC2_protein)
Get csv file with sequences according to given criteria:
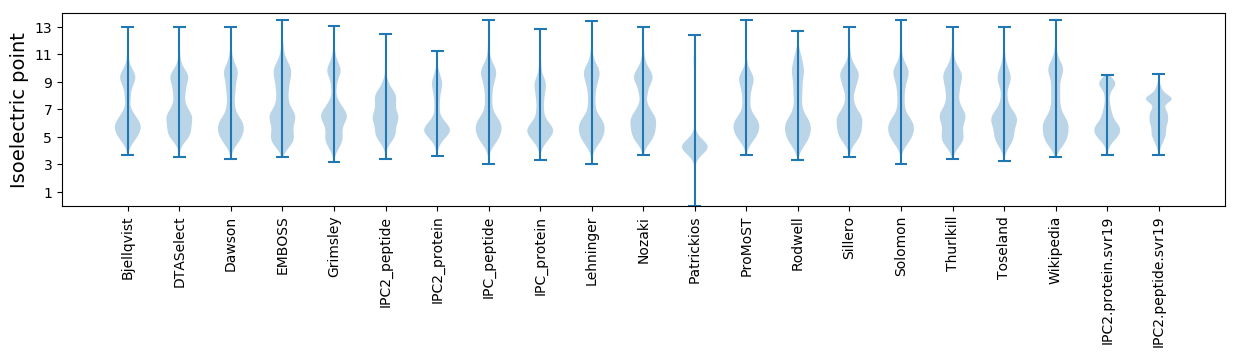
* You can choose from 21 different methods for calculating isoelectric point
Summary statistics related to proteome-wise predictions
Protein with the lowest isoelectric point:
>tr|A0A2U2H2B3|A0A2U2H2B3_YERPE Uncharacterized protein OS=Yersinia pestis OX=632 GN=YPO3245 PE=4 SV=1
MM1 pKa = 7.65KK2 pKa = 10.05ILVRR6 pKa = 11.84ISSSTDD12 pKa = 2.97YY13 pKa = 11.21DD14 pKa = 3.98VYY16 pKa = 10.97PLFMVKK22 pKa = 10.04CDD24 pKa = 3.57GLNDD28 pKa = 3.81EE29 pKa = 5.49EE30 pKa = 4.03IQAAIEE36 pKa = 4.17RR37 pKa = 11.84NLVEE41 pKa = 4.25YY42 pKa = 10.15TGMDD46 pKa = 3.74ADD48 pKa = 4.3SVHH51 pKa = 7.24VDD53 pKa = 3.62DD54 pKa = 7.1DD55 pKa = 4.74GVCWSNGSCWYY66 pKa = 10.82VDD68 pKa = 3.2DD69 pKa = 4.13TTPVSDD75 pKa = 3.86EE76 pKa = 4.25DD77 pKa = 3.77AAHH80 pKa = 7.27LEE82 pKa = 4.4RR83 pKa = 11.84ILGISTFEE91 pKa = 3.84
MM1 pKa = 7.65KK2 pKa = 10.05ILVRR6 pKa = 11.84ISSSTDD12 pKa = 2.97YY13 pKa = 11.21DD14 pKa = 3.98VYY16 pKa = 10.97PLFMVKK22 pKa = 10.04CDD24 pKa = 3.57GLNDD28 pKa = 3.81EE29 pKa = 5.49EE30 pKa = 4.03IQAAIEE36 pKa = 4.17RR37 pKa = 11.84NLVEE41 pKa = 4.25YY42 pKa = 10.15TGMDD46 pKa = 3.74ADD48 pKa = 4.3SVHH51 pKa = 7.24VDD53 pKa = 3.62DD54 pKa = 7.1DD55 pKa = 4.74GVCWSNGSCWYY66 pKa = 10.82VDD68 pKa = 3.2DD69 pKa = 4.13TTPVSDD75 pKa = 3.86EE76 pKa = 4.25DD77 pKa = 3.77AAHH80 pKa = 7.27LEE82 pKa = 4.4RR83 pKa = 11.84ILGISTFEE91 pKa = 3.84
Molecular weight: 10.2 kDa
Isoelectric point according different methods:
Protein with the highest isoelectric point:
>sp|Q8ZBA7|RL27_YERPE 50S ribosomal protein L27 OS=Yersinia pestis OX=632 GN=rpmA PE=3 SV=1
MM1 pKa = 7.45KK2 pKa = 9.51RR3 pKa = 11.84TFQPSVLKK11 pKa = 10.6RR12 pKa = 11.84NRR14 pKa = 11.84SHH16 pKa = 7.16GFRR19 pKa = 11.84ARR21 pKa = 11.84MATKK25 pKa = 10.4NGRR28 pKa = 11.84QVLARR33 pKa = 11.84RR34 pKa = 11.84RR35 pKa = 11.84AKK37 pKa = 10.18SRR39 pKa = 11.84SRR41 pKa = 11.84LTVSKK46 pKa = 11.03
MM1 pKa = 7.45KK2 pKa = 9.51RR3 pKa = 11.84TFQPSVLKK11 pKa = 10.6RR12 pKa = 11.84NRR14 pKa = 11.84SHH16 pKa = 7.16GFRR19 pKa = 11.84ARR21 pKa = 11.84MATKK25 pKa = 10.4NGRR28 pKa = 11.84QVLARR33 pKa = 11.84RR34 pKa = 11.84RR35 pKa = 11.84AKK37 pKa = 10.18SRR39 pKa = 11.84SRR41 pKa = 11.84LTVSKK46 pKa = 11.03
Molecular weight: 5.43 kDa
Isoelectric point according different methods:
Peptides (in silico digests for buttom-up proteomics)
Below you can find in silico digests of the whole proteome with Trypsin, Chymotrypsin, Trypsin+LysC, LysN, ArgC proteases suitable for different mass spec machines.| Try ESI |
 |
|---|
| ChTry ESI |
|
|---|
| ArgC ESI |
|
|---|
| LysN ESI |
|
|---|
| TryLysC ESI |
|
|---|
| Try MALDI |
|
|---|
| ChTry MALDI |
|
|---|
| ArgC MALDI |
|
|---|
| LysN MALDI |
|
|---|
| TryLysC MALDI |
|
|---|
| Try LTQ |
|
|---|
| ChTry LTQ |
|
|---|
| ArgC LTQ |
|
|---|
| LysN LTQ |
|
|---|
| TryLysC LTQ |
|
|---|
| Try MSlow |
|
|---|
| ChTry MSlow |
|
|---|
| ArgC MSlow |
|
|---|
| LysN MSlow |
|
|---|
| TryLysC MSlow |
|
|---|
| Try MShigh |
|
|---|
| ChTry MShigh |
|
|---|
| ArgC MShigh |
|
|---|
| LysN MShigh |
|
|---|
| TryLysC MShigh |
|
|---|
General Statistics
Number of major isoforms |
Number of additional isoforms |
Number of all proteins |
Number of amino acids |
Min. Seq. Length |
Max. Seq. Length |
Avg. Seq. Length |
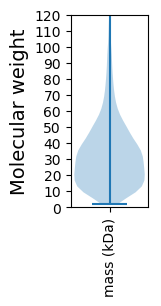
Avg. Mol. Weight |
|---|---|---|---|---|---|---|---|
1243634 |
14 |
3705 |
318.1 |
35.19 |
Amino acid frequency
Ala |
Cys |
Asp |
Glu |
Phe |
Gly |
His |
Ile |
Lys |
Leu |
|---|---|---|---|---|---|---|---|---|---|
9.245 ± 0.049 | 1.038 ± 0.014 |
5.166 ± 0.033 | 5.493 ± 0.04 |
3.798 ± 0.03 | 7.261 ± 0.046 |
2.256 ± 0.024 | 6.229 ± 0.035 |
4.348 ± 0.039 | 10.933 ± 0.055 |
Met |
Asn |
Gln |
Pro |
Arg |
Ser |
Thr |
Val |
Trp |
Tyr |
|---|---|---|---|---|---|---|---|---|---|
2.652 ± 0.021 | 4.095 ± 0.042 |
4.375 ± 0.032 | 4.846 ± 0.037 |
5.343 ± 0.036 | 6.297 ± 0.037 |
5.42 ± 0.045 | 6.899 ± 0.037 |
1.357 ± 0.018 | 2.949 ± 0.025 |
Most of the basic statistics you can see at this page can be downloaded from this CSV file
See this proteome in:

Proteome-pI is available under Creative Commons Attribution-NoDerivs license, for more details see here
| Reference: Kozlowski LP. Proteome-pI 2.0: Proteome Isoelectric Point Database Update. Nucleic Acids Res. 2021, doi: 10.1093/nar/gkab944 | Contact: Lukasz P. Kozlowski |