Pseudomonas phage YMC11/02/R656
Taxonomy: Viruses; Duplodnaviria; Heunggongvirae; Uroviricota; Caudoviricetes; Caudovirales; Siphoviridae; unclassified Siphoviridae
Average proteome isoelectric point is 6.35
Get precalculated fractions of proteins
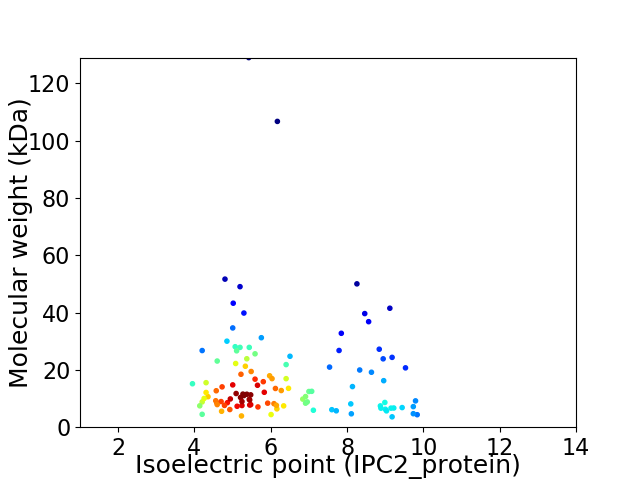
Virtual 2D-PAGE plot for 113 proteins (isoelectric point calculated using IPC2_protein)
Get csv file with sequences according to given criteria:
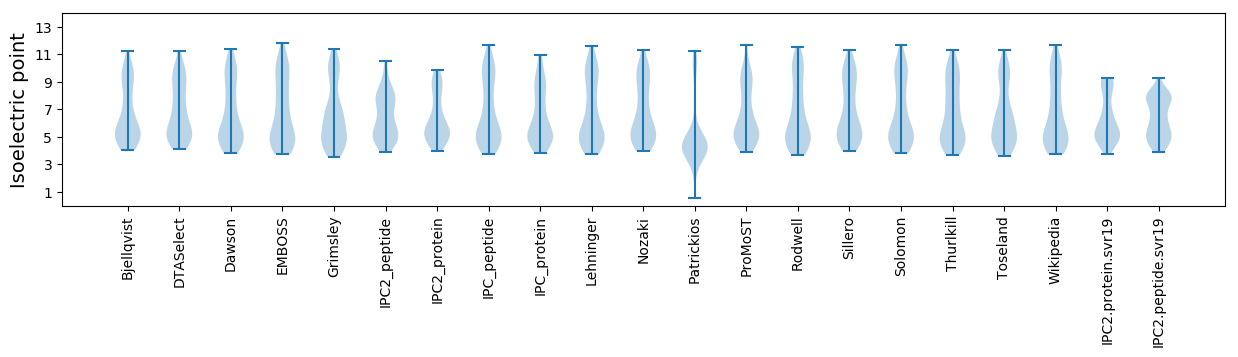
* You can choose from 21 different methods for calculating isoelectric point
Summary statistics related to proteome-wise predictions
Protein with the lowest isoelectric point:
>tr|A0A0S2SY83|A0A0S2SY83_9CAUD Uncharacterized protein OS=Pseudomonas phage YMC11/02/R656 OX=1755689 GN=BPPAER656_00280 PE=4 SV=1
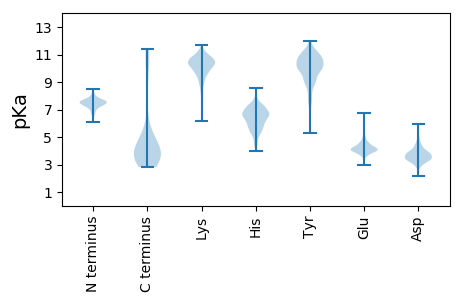
MM1 pKa = 6.54TQRR4 pKa = 11.84ILFFTAGPALTEE16 pKa = 4.07AEE18 pKa = 4.21KK19 pKa = 11.13SVVEE23 pKa = 3.96QLNALTPPTYY33 pKa = 10.74SVTVHH38 pKa = 6.26NGAVEE43 pKa = 3.85PDD45 pKa = 3.69YY46 pKa = 11.27VVPGDD51 pKa = 3.85YY52 pKa = 10.75AAGAIPQAYY61 pKa = 9.85AGLPVFDD68 pKa = 5.76PDD70 pKa = 4.12NPPAPAVGEE79 pKa = 4.25GQVVVSNDD87 pKa = 2.82ATVSVLPASGSMALASGTADD107 pKa = 3.3VASGALAGIRR117 pKa = 11.84LAATAAVVANGQTISVAGGTVTLSVAANVVTAVFTPEE154 pKa = 3.4
MM1 pKa = 6.54TQRR4 pKa = 11.84ILFFTAGPALTEE16 pKa = 4.07AEE18 pKa = 4.21KK19 pKa = 11.13SVVEE23 pKa = 3.96QLNALTPPTYY33 pKa = 10.74SVTVHH38 pKa = 6.26NGAVEE43 pKa = 3.85PDD45 pKa = 3.69YY46 pKa = 11.27VVPGDD51 pKa = 3.85YY52 pKa = 10.75AAGAIPQAYY61 pKa = 9.85AGLPVFDD68 pKa = 5.76PDD70 pKa = 4.12NPPAPAVGEE79 pKa = 4.25GQVVVSNDD87 pKa = 2.82ATVSVLPASGSMALASGTADD107 pKa = 3.3VASGALAGIRR117 pKa = 11.84LAATAAVVANGQTISVAGGTVTLSVAANVVTAVFTPEE154 pKa = 3.4
Molecular weight: 15.16 kDa
Isoelectric point according different methods:
Protein with the highest isoelectric point:
>tr|A0A0S2SY55|A0A0S2SY55_9CAUD Uncharacterized protein OS=Pseudomonas phage YMC11/02/R656 OX=1755689 GN=BPPAER656_00060 PE=4 SV=1
MM1 pKa = 7.42PAAASTEE8 pKa = 4.08IKK10 pKa = 10.47DD11 pKa = 4.02IARR14 pKa = 11.84PWPINGIGLAVRR26 pKa = 11.84IRR28 pKa = 11.84GGLAGQGARR37 pKa = 11.84IGQYY41 pKa = 10.64GGG43 pKa = 3.24
MM1 pKa = 7.42PAAASTEE8 pKa = 4.08IKK10 pKa = 10.47DD11 pKa = 4.02IARR14 pKa = 11.84PWPINGIGLAVRR26 pKa = 11.84IRR28 pKa = 11.84GGLAGQGARR37 pKa = 11.84IGQYY41 pKa = 10.64GGG43 pKa = 3.24
Molecular weight: 4.36 kDa
Isoelectric point according different methods:
Peptides (in silico digests for buttom-up proteomics)
Below you can find in silico digests of the whole proteome with Trypsin, Chymotrypsin, Trypsin+LysC, LysN, ArgC proteases suitable for different mass spec machines.| Try ESI |
 |
|---|
| ChTry ESI |
|
|---|
| ArgC ESI |
|
|---|
| LysN ESI |
|
|---|
| TryLysC ESI |
|
|---|
| Try MALDI |
|
|---|
| ChTry MALDI |
|
|---|
| ArgC MALDI |
|
|---|
| LysN MALDI |
|
|---|
| TryLysC MALDI |
|
|---|
| Try LTQ |
|
|---|
| ChTry LTQ |
|
|---|
| ArgC LTQ |
|
|---|
| LysN LTQ |
|
|---|
| TryLysC LTQ |
|
|---|
| Try MSlow |
|
|---|
| ChTry MSlow |
|
|---|
| ArgC MSlow |
|
|---|
| LysN MSlow |
|
|---|
| TryLysC MSlow |
|
|---|
| Try MShigh |
|
|---|
| ChTry MShigh |
|
|---|
| ArgC MShigh |
|
|---|
| LysN MShigh |
|
|---|
| TryLysC MShigh |
|
|---|
General Statistics
Number of major isoforms |
Number of additional isoforms |
Number of all proteins |
Number of amino acids |
Min. Seq. Length |
Max. Seq. Length |
Avg. Seq. Length |
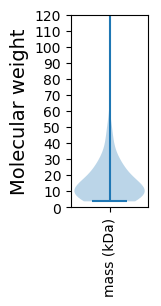
Avg. Mol. Weight |
|---|---|---|---|---|---|---|---|
0 |
17840 |
37 |
1185 |
157.9 |
17.46 |
Amino acid frequency
Ala |
Cys |
Asp |
Glu |
Phe |
Gly |
His |
Ile |
Lys |
Leu |
|---|---|---|---|---|---|---|---|---|---|
11.592 ± 0.503 | 1.278 ± 0.13 |
5.684 ± 0.186 | 7.27 ± 0.337 |
3.189 ± 0.167 | 7.556 ± 0.273 |
1.855 ± 0.179 | 4.989 ± 0.168 |
4.417 ± 0.23 | 8.335 ± 0.251 |
Met |
Asn |
Gln |
Pro |
Arg |
Ser |
Thr |
Val |
Trp |
Tyr |
|---|---|---|---|---|---|---|---|---|---|
2.472 ± 0.15 | 3.178 ± 0.181 |
4.266 ± 0.239 | 4.568 ± 0.285 |
7.209 ± 0.255 | 6.054 ± 0.259 |
4.871 ± 0.255 | 6.715 ± 0.235 |
1.721 ± 0.149 | 2.78 ± 0.161 |
Most of the basic statistics you can see at this page can be downloaded from this CSV file
See this proteome in:

Proteome-pI is available under Creative Commons Attribution-NoDerivs license, for more details see here
| Reference: Kozlowski LP. Proteome-pI 2.0: Proteome Isoelectric Point Database Update. Nucleic Acids Res. 2021, doi: 10.1093/nar/gkab944 | Contact: Lukasz P. Kozlowski |