Salmonella phage vB_SemP_Emek
Taxonomy: Viruses; Duplodnaviria; Heunggongvirae; Uroviricota; Caudoviricetes; Caudovirales; Podoviridae; Lederbergvirus; unclassified Lederbergvirus
Average proteome isoelectric point is 6.9
Get precalculated fractions of proteins
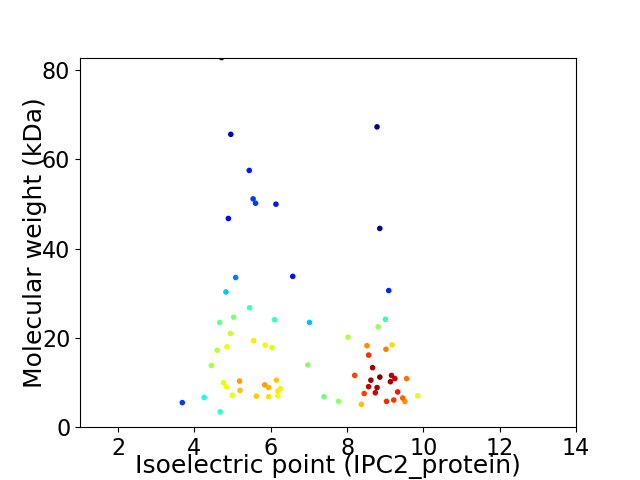
Virtual 2D-PAGE plot for 70 proteins (isoelectric point calculated using IPC2_protein)
Get csv file with sequences according to given criteria:
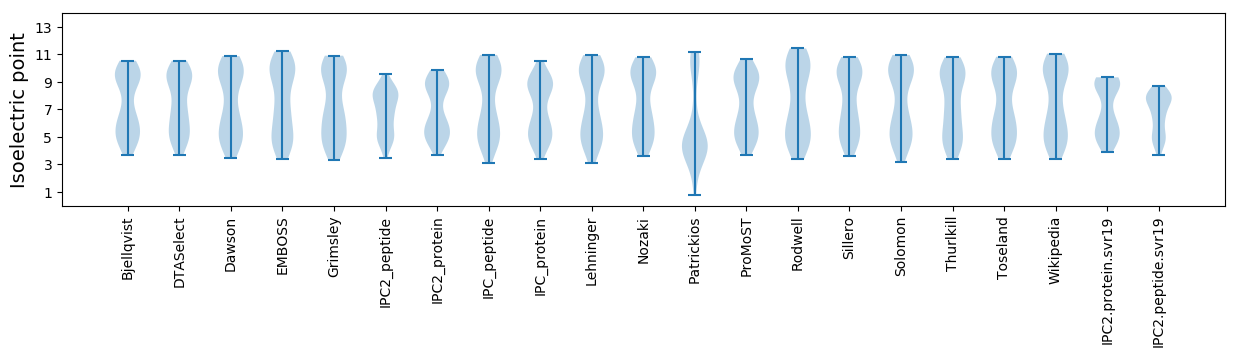
* You can choose from 21 different methods for calculating isoelectric point
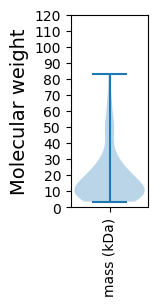
Summary statistics related to proteome-wise predictions
Protein with the lowest isoelectric point:
>tr|I6S1N0|I6S1N0_9CAUD Cro OS=Salmonella phage vB_SemP_Emek OX=1168548 GN=cro PE=4 SV=1
MM1 pKa = 7.26LHH3 pKa = 7.23DD4 pKa = 4.7FDD6 pKa = 6.33DD7 pKa = 4.46EE8 pKa = 4.25EE9 pKa = 5.37FIALSSPEE17 pKa = 3.65IEE19 pKa = 4.47EE20 pKa = 4.42EE21 pKa = 4.19VEE23 pKa = 4.03QQINLAAEE31 pKa = 4.07RR32 pKa = 11.84QNPVISWDD40 pKa = 3.48EE41 pKa = 3.67FAGYY45 pKa = 10.62YY46 pKa = 9.62SS47 pKa = 3.45
MM1 pKa = 7.26LHH3 pKa = 7.23DD4 pKa = 4.7FDD6 pKa = 6.33DD7 pKa = 4.46EE8 pKa = 4.25EE9 pKa = 5.37FIALSSPEE17 pKa = 3.65IEE19 pKa = 4.47EE20 pKa = 4.42EE21 pKa = 4.19VEE23 pKa = 4.03QQINLAAEE31 pKa = 4.07RR32 pKa = 11.84QNPVISWDD40 pKa = 3.48EE41 pKa = 3.67FAGYY45 pKa = 10.62YY46 pKa = 9.62SS47 pKa = 3.45
Molecular weight: 5.51 kDa
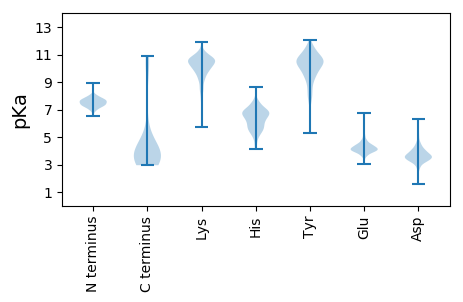
Isoelectric point according different methods:
Protein with the highest isoelectric point:
>tr|I6RSJ2|I6RSJ2_9CAUD NinZ OS=Salmonella phage vB_SemP_Emek OX=1168548 GN=ninZ PE=4 SV=1
MM1 pKa = 7.39ARR3 pKa = 11.84QRR5 pKa = 11.84RR6 pKa = 11.84SITDD10 pKa = 4.1IICEE14 pKa = 3.96NCKK17 pKa = 10.21YY18 pKa = 10.77LPTKK22 pKa = 10.48RR23 pKa = 11.84SRR25 pKa = 11.84NKK27 pKa = 9.52PKK29 pKa = 10.35PIPTEE34 pKa = 4.16SQVKK38 pKa = 8.12TFDD41 pKa = 3.4YY42 pKa = 11.21VYY44 pKa = 11.4GLLQSKK50 pKa = 7.75WNRR53 pKa = 11.84MRR55 pKa = 11.84KK56 pKa = 7.02TRR58 pKa = 3.69
MM1 pKa = 7.39ARR3 pKa = 11.84QRR5 pKa = 11.84RR6 pKa = 11.84SITDD10 pKa = 4.1IICEE14 pKa = 3.96NCKK17 pKa = 10.21YY18 pKa = 10.77LPTKK22 pKa = 10.48RR23 pKa = 11.84SRR25 pKa = 11.84NKK27 pKa = 9.52PKK29 pKa = 10.35PIPTEE34 pKa = 4.16SQVKK38 pKa = 8.12TFDD41 pKa = 3.4YY42 pKa = 11.21VYY44 pKa = 11.4GLLQSKK50 pKa = 7.75WNRR53 pKa = 11.84MRR55 pKa = 11.84KK56 pKa = 7.02TRR58 pKa = 3.69
Molecular weight: 7.03 kDa
Isoelectric point according different methods:
Peptides (in silico digests for buttom-up proteomics)
Below you can find in silico digests of the whole proteome with Trypsin, Chymotrypsin, Trypsin+LysC, LysN, ArgC proteases suitable for different mass spec machines.| Try ESI |
 |
|---|
| ChTry ESI |
|
|---|
| ArgC ESI |
|
|---|
| LysN ESI |
|
|---|
| TryLysC ESI |
|
|---|
| Try MALDI |
|
|---|
| ChTry MALDI |
|
|---|
| ArgC MALDI |
|
|---|
| LysN MALDI |
|
|---|
| TryLysC MALDI |
|
|---|
| Try LTQ |
|
|---|
| ChTry LTQ |
|
|---|
| ArgC LTQ |
|
|---|
| LysN LTQ |
|
|---|
| TryLysC LTQ |
|
|---|
| Try MSlow |
|
|---|
| ChTry MSlow |
|
|---|
| ArgC MSlow |
|
|---|
| LysN MSlow |
|
|---|
| TryLysC MSlow |
|
|---|
| Try MShigh |
|
|---|
| ChTry MShigh |
|
|---|
| ArgC MShigh |
|
|---|
| LysN MShigh |
|
|---|
| TryLysC MShigh |
|
|---|
General Statistics
Number of major isoforms |
Number of additional isoforms |
Number of all proteins |
Number of amino acids |
Min. Seq. Length |
Max. Seq. Length |
Avg. Seq. Length |
Avg. Mol. Weight |
|---|---|---|---|---|---|---|---|
0 |
12054 |
31 |
725 |
172.2 |
19.28 |
Amino acid frequency
Ala |
Cys |
Asp |
Glu |
Phe |
Gly |
His |
Ile |
Lys |
Leu |
|---|---|---|---|---|---|---|---|---|---|
9.433 ± 0.544 | 1.211 ± 0.146 |
5.932 ± 0.226 | 6.778 ± 0.313 |
3.219 ± 0.21 | 7.168 ± 0.399 |
1.742 ± 0.19 | 5.923 ± 0.203 |
6.322 ± 0.292 | 7.765 ± 0.265 |
Met |
Asn |
Gln |
Pro |
Arg |
Ser |
Thr |
Val |
Trp |
Tyr |
|---|---|---|---|---|---|---|---|---|---|
2.92 ± 0.179 | 4.762 ± 0.259 |
3.941 ± 0.199 | 4.521 ± 0.284 |
6.139 ± 0.322 | 6.172 ± 0.271 |
5.152 ± 0.278 | 5.782 ± 0.318 |
1.717 ± 0.16 | 3.401 ± 0.226 |
Most of the basic statistics you can see at this page can be downloaded from this CSV file
See this proteome in:

Proteome-pI is available under Creative Commons Attribution-NoDerivs license, for more details see here
| Reference: Kozlowski LP. Proteome-pI 2.0: Proteome Isoelectric Point Database Update. Nucleic Acids Res. 2021, doi: 10.1093/nar/gkab944 | Contact: Lukasz P. Kozlowski |