Enterobacteria phage SfI
Taxonomy: Viruses; Duplodnaviria; Heunggongvirae; Uroviricota; Caudoviricetes; Caudovirales; Myoviridae; unclassified Myoviridae
Average proteome isoelectric point is 7.19
Get precalculated fractions of proteins
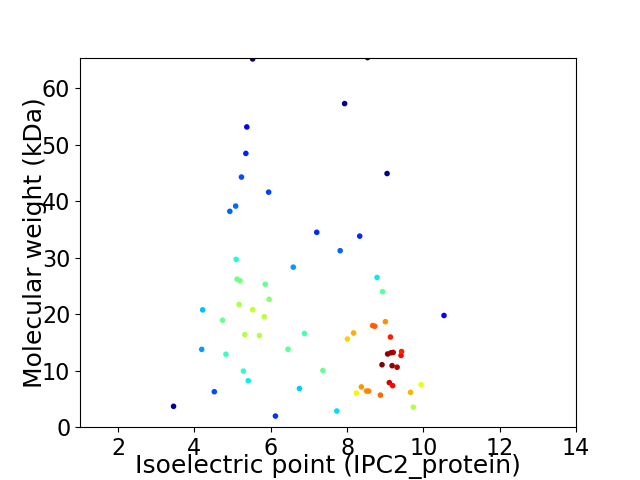
Virtual 2D-PAGE plot for 65 proteins (isoelectric point calculated using IPC2_protein)
Get csv file with sequences according to given criteria:
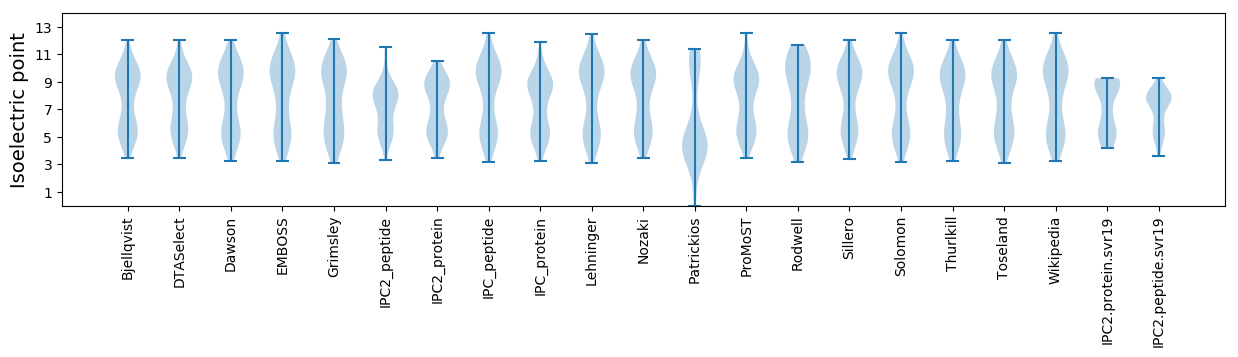
* You can choose from 21 different methods for calculating isoelectric point
Summary statistics related to proteome-wise predictions
Protein with the lowest isoelectric point:
>tr|M1FPM7|M1FPM7_9CAUD CII protein OS=Enterobacteria phage SfI OX=1225789 GN=CII PE=4 SV=1
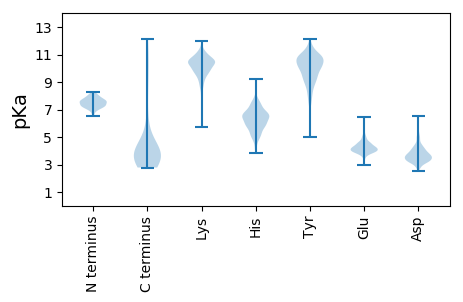
MM1 pKa = 7.56EE2 pKa = 4.6EE3 pKa = 3.77EE4 pKa = 3.94FEE6 pKa = 4.21EE7 pKa = 5.35FEE9 pKa = 4.23EE10 pKa = 4.87HH11 pKa = 6.47PQDD14 pKa = 5.15VMEE17 pKa = 4.57QYY19 pKa = 10.87QDD21 pKa = 3.33YY22 pKa = 9.44PYY24 pKa = 10.79DD25 pKa = 3.5YY26 pKa = 10.74DD27 pKa = 3.8YY28 pKa = 12.14
MM1 pKa = 7.56EE2 pKa = 4.6EE3 pKa = 3.77EE4 pKa = 3.94FEE6 pKa = 4.21EE7 pKa = 5.35FEE9 pKa = 4.23EE10 pKa = 4.87HH11 pKa = 6.47PQDD14 pKa = 5.15VMEE17 pKa = 4.57QYY19 pKa = 10.87QDD21 pKa = 3.33YY22 pKa = 9.44PYY24 pKa = 10.79DD25 pKa = 3.5YY26 pKa = 10.74DD27 pKa = 3.8YY28 pKa = 12.14
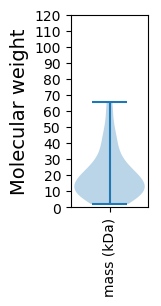
Molecular weight: 3.7 kDa
Isoelectric point according different methods:
Protein with the highest isoelectric point:
>tr|M1FJ65|M1FJ65_9CAUD Antitermination protein OS=Enterobacteria phage SfI OX=1225789 GN=CIII PE=4 SV=1
MM1 pKa = 7.55AMKK4 pKa = 10.22HH5 pKa = 5.08PHH7 pKa = 6.27DD8 pKa = 5.1NIRR11 pKa = 11.84VGAITFVYY19 pKa = 10.4SVTKK23 pKa = 10.38RR24 pKa = 11.84GWVFPGLSVIRR35 pKa = 11.84NPLKK39 pKa = 10.16AQRR42 pKa = 11.84LAEE45 pKa = 4.43EE46 pKa = 4.41INNKK50 pKa = 9.68RR51 pKa = 11.84EE52 pKa = 4.24SVV54 pKa = 3.31
MM1 pKa = 7.55AMKK4 pKa = 10.22HH5 pKa = 5.08PHH7 pKa = 6.27DD8 pKa = 5.1NIRR11 pKa = 11.84VGAITFVYY19 pKa = 10.4SVTKK23 pKa = 10.38RR24 pKa = 11.84GWVFPGLSVIRR35 pKa = 11.84NPLKK39 pKa = 10.16AQRR42 pKa = 11.84LAEE45 pKa = 4.43EE46 pKa = 4.41INNKK50 pKa = 9.68RR51 pKa = 11.84EE52 pKa = 4.24SVV54 pKa = 3.31
Molecular weight: 6.18 kDa
Isoelectric point according different methods:
Peptides (in silico digests for buttom-up proteomics)
Below you can find in silico digests of the whole proteome with Trypsin, Chymotrypsin, Trypsin+LysC, LysN, ArgC proteases suitable for different mass spec machines.| Try ESI |
 |
|---|
| ChTry ESI |
|
|---|
| ArgC ESI |
|
|---|
| LysN ESI |
|
|---|
| TryLysC ESI |
|
|---|
| Try MALDI |
|
|---|
| ChTry MALDI |
|
|---|
| ArgC MALDI |
|
|---|
| LysN MALDI |
|
|---|
| TryLysC MALDI |
|
|---|
| Try LTQ |
|
|---|
| ChTry LTQ |
|
|---|
| ArgC LTQ |
|
|---|
| LysN LTQ |
|
|---|
| TryLysC LTQ |
|
|---|
| Try MSlow |
|
|---|
| ChTry MSlow |
|
|---|
| ArgC MSlow |
|
|---|
| LysN MSlow |
|
|---|
| TryLysC MSlow |
|
|---|
| Try MShigh |
|
|---|
| ChTry MShigh |
|
|---|
| ArgC MShigh |
|
|---|
| LysN MShigh |
|
|---|
| TryLysC MShigh |
|
|---|
General Statistics
Number of major isoforms |
Number of additional isoforms |
Number of all proteins |
Number of amino acids |
Min. Seq. Length |
Max. Seq. Length |
Avg. Seq. Length |
Avg. Mol. Weight |
|---|---|---|---|---|---|---|---|
0 |
11898 |
18 |
611 |
183.0 |
20.5 |
Amino acid frequency
Ala |
Cys |
Asp |
Glu |
Phe |
Gly |
His |
Ile |
Lys |
Leu |
|---|---|---|---|---|---|---|---|---|---|
8.993 ± 0.323 | 1.471 ± 0.175 |
5.682 ± 0.272 | 5.984 ± 0.284 |
3.673 ± 0.304 | 6.867 ± 0.389 |
1.79 ± 0.173 | 5.715 ± 0.342 |
5.892 ± 0.383 | 8.548 ± 0.323 |
Met |
Asn |
Gln |
Pro |
Arg |
Ser |
Thr |
Val |
Trp |
Tyr |
|---|---|---|---|---|---|---|---|---|---|
2.79 ± 0.208 | 4.328 ± 0.19 |
4.244 ± 0.162 | 3.866 ± 0.203 |
6.455 ± 0.439 | 6.161 ± 0.288 |
6.11 ± 0.335 | 6.497 ± 0.292 |
1.933 ± 0.177 | 3.001 ± 0.195 |
Most of the basic statistics you can see at this page can be downloaded from this CSV file
See this proteome in:

Proteome-pI is available under Creative Commons Attribution-NoDerivs license, for more details see here
| Reference: Kozlowski LP. Proteome-pI 2.0: Proteome Isoelectric Point Database Update. Nucleic Acids Res. 2021, doi: 10.1093/nar/gkab944 | Contact: Lukasz P. Kozlowski |