Mycobacterium phage LastJedi
Taxonomy: Viruses; Duplodnaviria; Heunggongvirae; Uroviricota; Caudoviricetes; Caudovirales; Siphoviridae; Cheoctovirus; unclassified Cheoctovirus
Average proteome isoelectric point is 5.95
Get precalculated fractions of proteins
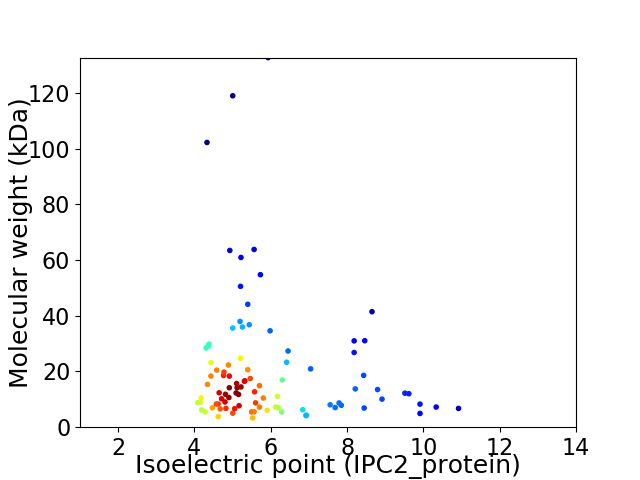
Virtual 2D-PAGE plot for 94 proteins (isoelectric point calculated using IPC2_protein)
Get csv file with sequences according to given criteria:
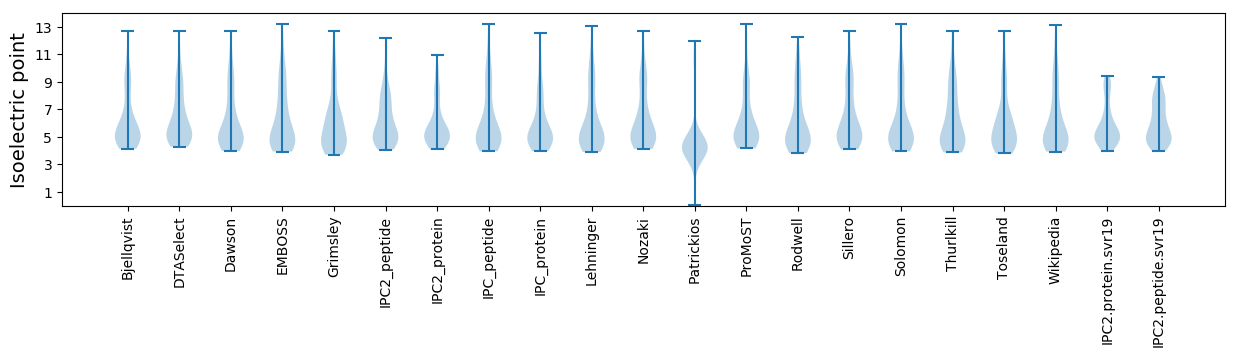
* You can choose from 21 different methods for calculating isoelectric point
Summary statistics related to proteome-wise predictions
Protein with the lowest isoelectric point:
>tr|A0A6N0A5I0|A0A6N0A5I0_9CAUD Uncharacterized protein OS=Mycobacterium phage LastJedi OX=2707031 GN=28 PE=4 SV=1
MM1 pKa = 7.71SDD3 pKa = 5.03CLLCDD8 pKa = 3.92HH9 pKa = 7.15PRR11 pKa = 11.84STHH14 pKa = 4.44TPEE17 pKa = 3.71CRR19 pKa = 11.84VRR21 pKa = 11.84MGIDD25 pKa = 3.58PDD27 pKa = 4.04DD28 pKa = 3.79MSVYY32 pKa = 8.7TACLCPGWEE41 pKa = 4.2GTKK44 pKa = 10.64DD45 pKa = 3.58GEE47 pKa = 4.15EE48 pKa = 4.21DD49 pKa = 3.16
MM1 pKa = 7.71SDD3 pKa = 5.03CLLCDD8 pKa = 3.92HH9 pKa = 7.15PRR11 pKa = 11.84STHH14 pKa = 4.44TPEE17 pKa = 3.71CRR19 pKa = 11.84VRR21 pKa = 11.84MGIDD25 pKa = 3.58PDD27 pKa = 4.04DD28 pKa = 3.79MSVYY32 pKa = 8.7TACLCPGWEE41 pKa = 4.2GTKK44 pKa = 10.64DD45 pKa = 3.58GEE47 pKa = 4.15EE48 pKa = 4.21DD49 pKa = 3.16
Molecular weight: 5.47 kDa
Isoelectric point according different methods:
Protein with the highest isoelectric point:
>tr|A0A6N0A5G4|A0A6N0A5G4_9CAUD Uncharacterized protein OS=Mycobacterium phage LastJedi OX=2707031 GN=32 PE=4 SV=1
MM1 pKa = 7.43TFFSGRR7 pKa = 11.84RR8 pKa = 11.84GSARR12 pKa = 11.84HH13 pKa = 5.13GKK15 pKa = 8.78GVGMARR21 pKa = 11.84RR22 pKa = 11.84GMARR26 pKa = 11.84LGTTWQAWLGMARR39 pKa = 11.84LGRR42 pKa = 11.84AWLGAARR49 pKa = 11.84HH50 pKa = 5.89GRR52 pKa = 11.84HH53 pKa = 6.33DD54 pKa = 3.38MAGAARR60 pKa = 11.84RR61 pKa = 11.84GG62 pKa = 3.45
MM1 pKa = 7.43TFFSGRR7 pKa = 11.84RR8 pKa = 11.84GSARR12 pKa = 11.84HH13 pKa = 5.13GKK15 pKa = 8.78GVGMARR21 pKa = 11.84RR22 pKa = 11.84GMARR26 pKa = 11.84LGTTWQAWLGMARR39 pKa = 11.84LGRR42 pKa = 11.84AWLGAARR49 pKa = 11.84HH50 pKa = 5.89GRR52 pKa = 11.84HH53 pKa = 6.33DD54 pKa = 3.38MAGAARR60 pKa = 11.84RR61 pKa = 11.84GG62 pKa = 3.45
Molecular weight: 6.74 kDa
Isoelectric point according different methods:
Peptides (in silico digests for buttom-up proteomics)
Below you can find in silico digests of the whole proteome with Trypsin, Chymotrypsin, Trypsin+LysC, LysN, ArgC proteases suitable for different mass spec machines.| Try ESI |
 |
|---|
| ChTry ESI |
|
|---|
| ArgC ESI |
|
|---|
| LysN ESI |
|
|---|
| TryLysC ESI |
|
|---|
| Try MALDI |
|
|---|
| ChTry MALDI |
|
|---|
| ArgC MALDI |
|
|---|
| LysN MALDI |
|
|---|
| TryLysC MALDI |
|
|---|
| Try LTQ |
|
|---|
| ChTry LTQ |
|
|---|
| ArgC LTQ |
|
|---|
| LysN LTQ |
|
|---|
| TryLysC LTQ |
|
|---|
| Try MSlow |
|
|---|
| ChTry MSlow |
|
|---|
| ArgC MSlow |
|
|---|
| LysN MSlow |
|
|---|
| TryLysC MSlow |
|
|---|
| Try MShigh |
|
|---|
| ChTry MShigh |
|
|---|
| ArgC MShigh |
|
|---|
| LysN MShigh |
|
|---|
| TryLysC MShigh |
|
|---|
General Statistics
Number of major isoforms |
Number of additional isoforms |
Number of all proteins |
Number of amino acids |
Min. Seq. Length |
Max. Seq. Length |
Avg. Seq. Length |
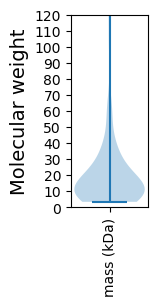
Avg. Mol. Weight |
|---|---|---|---|---|---|---|---|
0 |
17574 |
30 |
1183 |
187.0 |
20.57 |
Amino acid frequency
Ala |
Cys |
Asp |
Glu |
Phe |
Gly |
His |
Ile |
Lys |
Leu |
|---|---|---|---|---|---|---|---|---|---|
10.544 ± 0.484 | 1.275 ± 0.166 |
6.942 ± 0.19 | 6.094 ± 0.298 |
2.936 ± 0.178 | 8.245 ± 0.453 |
2.356 ± 0.176 | 4.364 ± 0.196 |
3.408 ± 0.197 | 7.642 ± 0.222 |
Met |
Asn |
Gln |
Pro |
Arg |
Ser |
Thr |
Val |
Trp |
Tyr |
|---|---|---|---|---|---|---|---|---|---|
2.293 ± 0.13 | 3.135 ± 0.166 |
6.094 ± 0.219 | 3.534 ± 0.149 |
7.198 ± 0.329 | 5.377 ± 0.186 |
6.584 ± 0.275 | 7.266 ± 0.296 |
2.253 ± 0.141 | 2.458 ± 0.151 |
Most of the basic statistics you can see at this page can be downloaded from this CSV file
See this proteome in:

Proteome-pI is available under Creative Commons Attribution-NoDerivs license, for more details see here
| Reference: Kozlowski LP. Proteome-pI 2.0: Proteome Isoelectric Point Database Update. Nucleic Acids Res. 2021, doi: 10.1093/nar/gkab944 | Contact: Lukasz P. Kozlowski |