Pseudomonas phage Epa33
Taxonomy: Viruses; Duplodnaviria; Heunggongvirae; Uroviricota; Caudoviricetes; Caudovirales; Podoviridae; Hollowayvirus; unclassified Hollowayvirus
Average proteome isoelectric point is 6.65
Get precalculated fractions of proteins
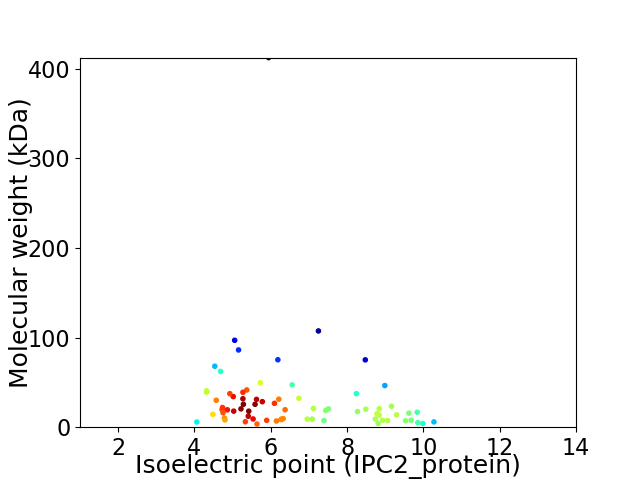
Virtual 2D-PAGE plot for 72 proteins (isoelectric point calculated using IPC2_protein)
Get csv file with sequences according to given criteria:
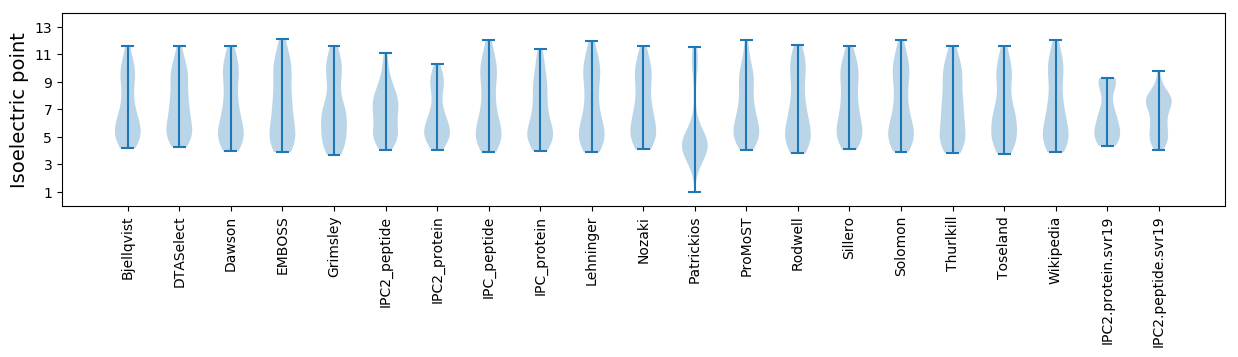
* You can choose from 21 different methods for calculating isoelectric point
Summary statistics related to proteome-wise predictions
Protein with the lowest isoelectric point:
>tr|A0A6G9LK17|A0A6G9LK17_9CAUD Uncharacterized protein OS=Pseudomonas phage Epa33 OX=2719194 GN=33_00005 PE=4 SV=1
MM1 pKa = 5.6WTYY4 pKa = 10.91RR5 pKa = 11.84EE6 pKa = 3.97RR7 pKa = 11.84RR8 pKa = 11.84NRR10 pKa = 11.84AAFSNAQHH18 pKa = 6.38AWDD21 pKa = 4.68FARR24 pKa = 11.84DD25 pKa = 3.96PLWDD29 pKa = 3.67QPDD32 pKa = 4.13PEE34 pKa = 6.12PEE36 pKa = 4.63DD37 pKa = 4.19EE38 pKa = 4.35NQEE41 pKa = 4.22DD42 pKa = 4.5DD43 pKa = 5.05DD44 pKa = 4.97GLGEE48 pKa = 4.05
MM1 pKa = 5.6WTYY4 pKa = 10.91RR5 pKa = 11.84EE6 pKa = 3.97RR7 pKa = 11.84RR8 pKa = 11.84NRR10 pKa = 11.84AAFSNAQHH18 pKa = 6.38AWDD21 pKa = 4.68FARR24 pKa = 11.84DD25 pKa = 3.96PLWDD29 pKa = 3.67QPDD32 pKa = 4.13PEE34 pKa = 6.12PEE36 pKa = 4.63DD37 pKa = 4.19EE38 pKa = 4.35NQEE41 pKa = 4.22DD42 pKa = 4.5DD43 pKa = 5.05DD44 pKa = 4.97GLGEE48 pKa = 4.05
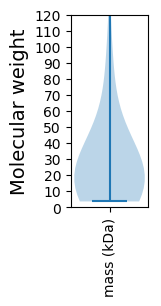
Molecular weight: 5.78 kDa
Isoelectric point according different methods:
Protein with the highest isoelectric point:
>tr|A0A6G9LJS3|A0A6G9LJS3_9CAUD Capsid protein OS=Pseudomonas phage Epa33 OX=2719194 GN=33_00045 PE=4 SV=1
MM1 pKa = 7.11NRR3 pKa = 11.84VHH5 pKa = 7.09IKK7 pKa = 9.55TFASEE12 pKa = 4.23HH13 pKa = 5.19GQSRR17 pKa = 11.84AAALLGITQGALSKK31 pKa = 10.51ALRR34 pKa = 11.84VGRR37 pKa = 11.84DD38 pKa = 2.95IYY40 pKa = 10.31VTAHH44 pKa = 6.91ADD46 pKa = 3.47GTFTAEE52 pKa = 4.16EE53 pKa = 4.5VRR55 pKa = 11.84TFPAQKK61 pKa = 10.15VRR63 pKa = 11.84FVSS66 pKa = 3.52
MM1 pKa = 7.11NRR3 pKa = 11.84VHH5 pKa = 7.09IKK7 pKa = 9.55TFASEE12 pKa = 4.23HH13 pKa = 5.19GQSRR17 pKa = 11.84AAALLGITQGALSKK31 pKa = 10.51ALRR34 pKa = 11.84VGRR37 pKa = 11.84DD38 pKa = 2.95IYY40 pKa = 10.31VTAHH44 pKa = 6.91ADD46 pKa = 3.47GTFTAEE52 pKa = 4.16EE53 pKa = 4.5VRR55 pKa = 11.84TFPAQKK61 pKa = 10.15VRR63 pKa = 11.84FVSS66 pKa = 3.52
Molecular weight: 7.19 kDa
Isoelectric point according different methods:
Peptides (in silico digests for buttom-up proteomics)
Below you can find in silico digests of the whole proteome with Trypsin, Chymotrypsin, Trypsin+LysC, LysN, ArgC proteases suitable for different mass spec machines.| Try ESI |
 |
|---|
| ChTry ESI |
|
|---|
| ArgC ESI |
|
|---|
| LysN ESI |
|
|---|
| TryLysC ESI |
|
|---|
| Try MALDI |
|
|---|
| ChTry MALDI |
|
|---|
| ArgC MALDI |
|
|---|
| LysN MALDI |
|
|---|
| TryLysC MALDI |
|
|---|
| Try LTQ |
|
|---|
| ChTry LTQ |
|
|---|
| ArgC LTQ |
|
|---|
| LysN LTQ |
|
|---|
| TryLysC LTQ |
|
|---|
| Try MSlow |
|
|---|
| ChTry MSlow |
|
|---|
| ArgC MSlow |
|
|---|
| LysN MSlow |
|
|---|
| TryLysC MSlow |
|
|---|
| Try MShigh |
|
|---|
| ChTry MShigh |
|
|---|
| ArgC MShigh |
|
|---|
| LysN MShigh |
|
|---|
| TryLysC MShigh |
|
|---|
General Statistics
Number of major isoforms |
Number of additional isoforms |
Number of all proteins |
Number of amino acids |
Min. Seq. Length |
Max. Seq. Length |
Avg. Seq. Length |
Avg. Mol. Weight |
|---|---|---|---|---|---|---|---|
0 |
20324 |
29 |
3799 |
282.3 |
30.89 |
Amino acid frequency
Ala |
Cys |
Asp |
Glu |
Phe |
Gly |
His |
Ile |
Lys |
Leu |
|---|---|---|---|---|---|---|---|---|---|
12.857 ± 0.571 | 0.777 ± 0.164 |
6.219 ± 0.197 | 6.17 ± 0.301 |
2.883 ± 0.146 | 7.794 ± 0.269 |
2.052 ± 0.182 | 4.227 ± 0.264 |
3.902 ± 0.278 | 8.128 ± 0.276 |
Met |
Asn |
Gln |
Pro |
Arg |
Ser |
Thr |
Val |
Trp |
Tyr |
|---|---|---|---|---|---|---|---|---|---|
2.372 ± 0.143 | 3.051 ± 0.135 |
5.501 ± 0.361 | 5.097 ± 0.284 |
7.316 ± 0.312 | 5.466 ± 0.182 |
5.373 ± 0.294 | 6.687 ± 0.265 |
1.584 ± 0.158 | 2.544 ± 0.219 |
Most of the basic statistics you can see at this page can be downloaded from this CSV file
See this proteome in:

Proteome-pI is available under Creative Commons Attribution-NoDerivs license, for more details see here
| Reference: Kozlowski LP. Proteome-pI 2.0: Proteome Isoelectric Point Database Update. Nucleic Acids Res. 2021, doi: 10.1093/nar/gkab944 | Contact: Lukasz P. Kozlowski |