Proteus phage Saba
Taxonomy: Viruses; Duplodnaviria; Heunggongvirae; Uroviricota; Caudoviricetes; Caudovirales; Siphoviridae; unclassified Siphoviridae
Average proteome isoelectric point is 6.42
Get precalculated fractions of proteins
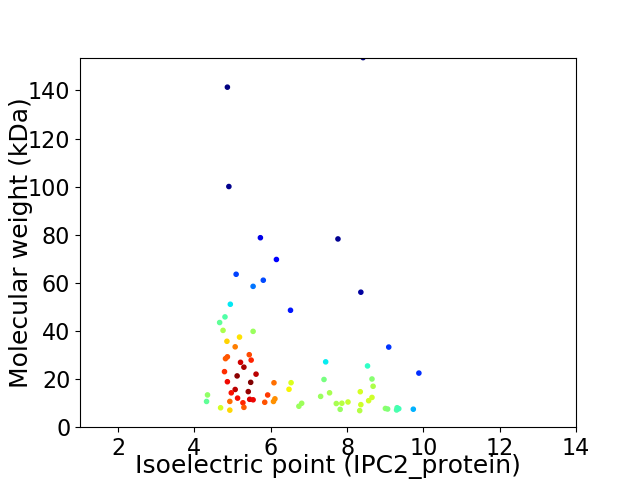
Virtual 2D-PAGE plot for 76 proteins (isoelectric point calculated using IPC2_protein)
Get csv file with sequences according to given criteria:
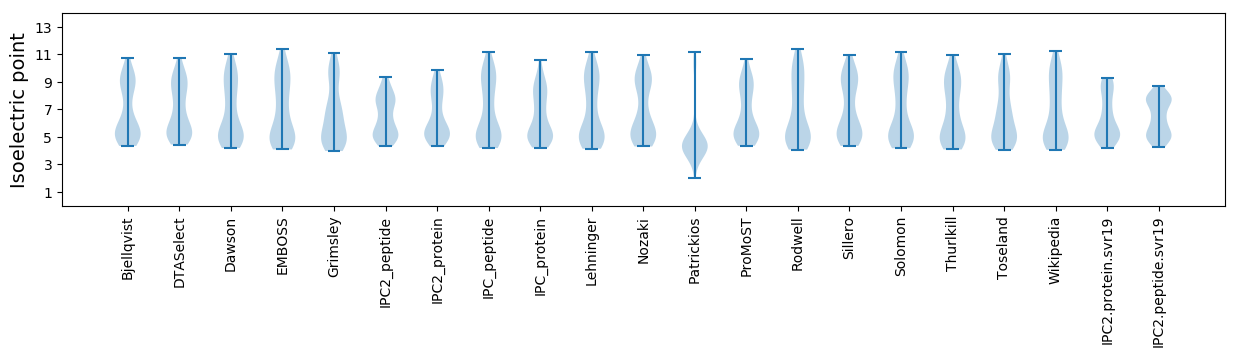
* You can choose from 21 different methods for calculating isoelectric point
Summary statistics related to proteome-wise predictions
Protein with the lowest isoelectric point:
>tr|A0A5B9NF04|A0A5B9NF04_9CAUD Uncharacterized protein OS=Proteus phage Saba OX=2596672 GN=CPT_Saba_020 PE=4 SV=1
MM1 pKa = 7.14YY2 pKa = 10.98NVMLSIAGTLAVLMVMFYY20 pKa = 10.94ALYY23 pKa = 9.04WVVEE27 pKa = 4.15AFDD30 pKa = 3.68MGIGLRR36 pKa = 11.84DD37 pKa = 3.51FFGRR41 pKa = 11.84TAAICFVLLVFDD53 pKa = 5.76IILSVAFLFIVKK65 pKa = 9.51IWEE68 pKa = 4.25SLVV71 pKa = 3.31
MM1 pKa = 7.14YY2 pKa = 10.98NVMLSIAGTLAVLMVMFYY20 pKa = 10.94ALYY23 pKa = 9.04WVVEE27 pKa = 4.15AFDD30 pKa = 3.68MGIGLRR36 pKa = 11.84DD37 pKa = 3.51FFGRR41 pKa = 11.84TAAICFVLLVFDD53 pKa = 5.76IILSVAFLFIVKK65 pKa = 9.51IWEE68 pKa = 4.25SLVV71 pKa = 3.31
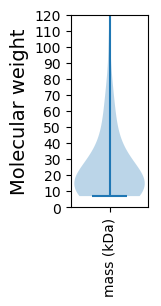
Molecular weight: 8.08 kDa
Isoelectric point according different methods:
Protein with the highest isoelectric point:
>tr|A0A5B9NBN8|A0A5B9NBN8_9CAUD Uncharacterized protein OS=Proteus phage Saba OX=2596672 GN=CPT_Saba_037 PE=4 SV=1
MM1 pKa = 7.46SSEE4 pKa = 4.3RR5 pKa = 11.84EE6 pKa = 3.83KK7 pKa = 10.92QAANLLKK14 pKa = 10.53LKK16 pKa = 10.28PGDD19 pKa = 3.94SFFVACLPDD28 pKa = 3.91KK29 pKa = 9.67LTHH32 pKa = 6.13IRR34 pKa = 11.84RR35 pKa = 11.84LGYY38 pKa = 10.42KK39 pKa = 10.33LGIKK43 pKa = 10.41LSFRR47 pKa = 11.84FVAVDD52 pKa = 4.33PIYY55 pKa = 10.97GLAGTRR61 pKa = 11.84VTRR64 pKa = 11.84KK65 pKa = 9.33RR66 pKa = 3.36
MM1 pKa = 7.46SSEE4 pKa = 4.3RR5 pKa = 11.84EE6 pKa = 3.83KK7 pKa = 10.92QAANLLKK14 pKa = 10.53LKK16 pKa = 10.28PGDD19 pKa = 3.94SFFVACLPDD28 pKa = 3.91KK29 pKa = 9.67LTHH32 pKa = 6.13IRR34 pKa = 11.84RR35 pKa = 11.84LGYY38 pKa = 10.42KK39 pKa = 10.33LGIKK43 pKa = 10.41LSFRR47 pKa = 11.84FVAVDD52 pKa = 4.33PIYY55 pKa = 10.97GLAGTRR61 pKa = 11.84VTRR64 pKa = 11.84KK65 pKa = 9.33RR66 pKa = 3.36
Molecular weight: 7.48 kDa
Isoelectric point according different methods:
Peptides (in silico digests for buttom-up proteomics)
Below you can find in silico digests of the whole proteome with Trypsin, Chymotrypsin, Trypsin+LysC, LysN, ArgC proteases suitable for different mass spec machines.| Try ESI |
 |
|---|
| ChTry ESI |
|
|---|
| ArgC ESI |
|
|---|
| LysN ESI |
|
|---|
| TryLysC ESI |
|
|---|
| Try MALDI |
|
|---|
| ChTry MALDI |
|
|---|
| ArgC MALDI |
|
|---|
| LysN MALDI |
|
|---|
| TryLysC MALDI |
|
|---|
| Try LTQ |
|
|---|
| ChTry LTQ |
|
|---|
| ArgC LTQ |
|
|---|
| LysN LTQ |
|
|---|
| TryLysC LTQ |
|
|---|
| Try MSlow |
|
|---|
| ChTry MSlow |
|
|---|
| ArgC MSlow |
|
|---|
| LysN MSlow |
|
|---|
| TryLysC MSlow |
|
|---|
| Try MShigh |
|
|---|
| ChTry MShigh |
|
|---|
| ArgC MShigh |
|
|---|
| LysN MShigh |
|
|---|
| TryLysC MShigh |
|
|---|
General Statistics
Number of major isoforms |
Number of additional isoforms |
Number of all proteins |
Number of amino acids |
Min. Seq. Length |
Max. Seq. Length |
Avg. Seq. Length |
Avg. Mol. Weight |
|---|---|---|---|---|---|---|---|
0 |
18900 |
62 |
1436 |
248.7 |
27.7 |
Amino acid frequency
Ala |
Cys |
Asp |
Glu |
Phe |
Gly |
His |
Ile |
Lys |
Leu |
|---|---|---|---|---|---|---|---|---|---|
8.635 ± 0.565 | 1.032 ± 0.138 |
6.529 ± 0.222 | 6.735 ± 0.198 |
4.053 ± 0.183 | 7.18 ± 0.253 |
1.566 ± 0.117 | 5.995 ± 0.138 |
6.561 ± 0.285 | 7.434 ± 0.201 |
Met |
Asn |
Gln |
Pro |
Arg |
Ser |
Thr |
Val |
Trp |
Tyr |
|---|---|---|---|---|---|---|---|---|---|
2.693 ± 0.137 | 4.196 ± 0.171 |
4.392 ± 0.31 | 2.984 ± 0.239 |
5.582 ± 0.207 | 6.407 ± 0.274 |
5.624 ± 0.193 | 7.635 ± 0.323 |
1.429 ± 0.134 | 3.339 ± 0.17 |
Most of the basic statistics you can see at this page can be downloaded from this CSV file
See this proteome in:

Proteome-pI is available under Creative Commons Attribution-NoDerivs license, for more details see here
| Reference: Kozlowski LP. Proteome-pI 2.0: Proteome Isoelectric Point Database Update. Nucleic Acids Res. 2021, doi: 10.1093/nar/gkab944 | Contact: Lukasz P. Kozlowski |