Thaumarchaeota archaeon SCGC AC-337_F14
Taxonomy: cellular organisms; Archaea; TACK group; Thaumarchaeota; unclassified Thaumarchaeota
Average proteome isoelectric point is 6.8
Get precalculated fractions of proteins
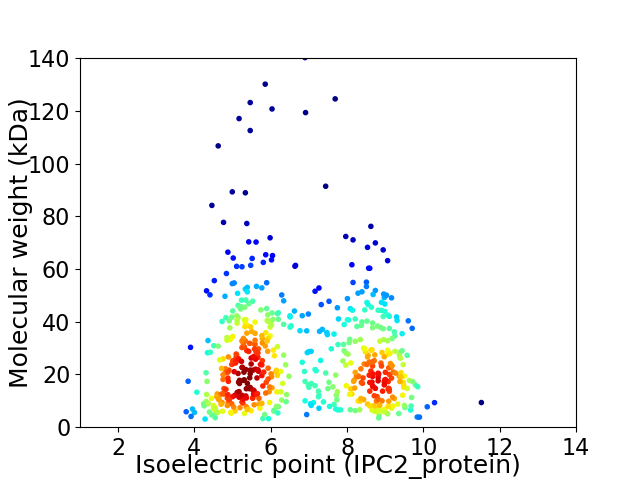
Virtual 2D-PAGE plot for 560 proteins (isoelectric point calculated using IPC2_protein)
Get csv file with sequences according to given criteria:
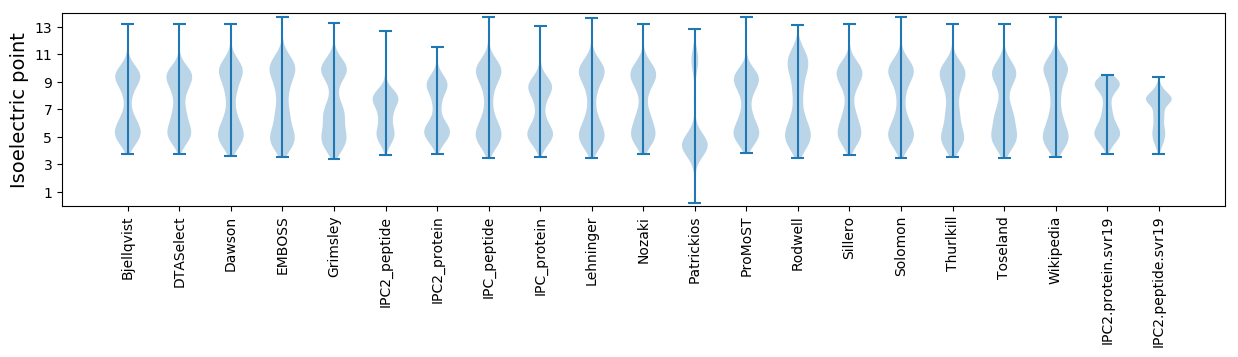
* You can choose from 21 different methods for calculating isoelectric point
Summary statistics related to proteome-wise predictions
Protein with the lowest isoelectric point:
>tr|A0A329CLD4|A0A329CLD4_9ARCH Uncharacterized protein OS=Thaumarchaeota archaeon SCGC AC-337_F14 OX=1465461 GN=BGW87_1152 PE=4 SV=1
MM1 pKa = 7.47NSYY4 pKa = 10.87IMLVPVTILILAGTGVVSQAFAATVITIEE33 pKa = 4.14TDD35 pKa = 2.71KK36 pKa = 11.11DD37 pKa = 3.61IYY39 pKa = 11.37DD40 pKa = 3.79HH41 pKa = 7.26ASTIILTGNVDD52 pKa = 3.68PVDD55 pKa = 3.9LRR57 pKa = 11.84GSEE60 pKa = 3.96VTIMCKK66 pKa = 10.19SPGGMGVCGIYY77 pKa = 9.99QLSVNSDD84 pKa = 3.57GNFSVSINTATFLMKK99 pKa = 10.18KK100 pKa = 10.19DD101 pKa = 3.84GIYY104 pKa = 10.3EE105 pKa = 4.01FQANYY110 pKa = 10.59SGLADD115 pKa = 3.36VTVSVEE121 pKa = 3.77LTNAIEE127 pKa = 4.11TSEE130 pKa = 4.15TGTAEE135 pKa = 3.75TGTAVIGTAVTGTGEE150 pKa = 4.16AGTDD154 pKa = 3.1EE155 pKa = 4.19VSFYY159 pKa = 11.4KK160 pKa = 10.66LAPGQIEE167 pKa = 4.06YY168 pKa = 10.45DD169 pKa = 3.6ITCNASPAFFANADD183 pKa = 3.71DD184 pKa = 4.41DD185 pKa = 5.48SIVILLDD192 pKa = 3.49ATDD195 pKa = 5.21DD196 pKa = 4.76GILTITLHH204 pKa = 7.28DD205 pKa = 4.14EE206 pKa = 4.52LIKK209 pKa = 10.98PFDD212 pKa = 4.67DD213 pKa = 3.66GTFVVIVDD221 pKa = 3.83NQVMQDD227 pKa = 3.15FTQIGNTLTIPCLAGTEE244 pKa = 4.24KK245 pKa = 10.5IEE247 pKa = 4.42IHH249 pKa = 6.32GSWAIPEE256 pKa = 4.3FGVIAAMILAVAIISIIVVTAKK278 pKa = 9.5TRR280 pKa = 11.84LSIVPRR286 pKa = 11.84YY287 pKa = 9.45
MM1 pKa = 7.47NSYY4 pKa = 10.87IMLVPVTILILAGTGVVSQAFAATVITIEE33 pKa = 4.14TDD35 pKa = 2.71KK36 pKa = 11.11DD37 pKa = 3.61IYY39 pKa = 11.37DD40 pKa = 3.79HH41 pKa = 7.26ASTIILTGNVDD52 pKa = 3.68PVDD55 pKa = 3.9LRR57 pKa = 11.84GSEE60 pKa = 3.96VTIMCKK66 pKa = 10.19SPGGMGVCGIYY77 pKa = 9.99QLSVNSDD84 pKa = 3.57GNFSVSINTATFLMKK99 pKa = 10.18KK100 pKa = 10.19DD101 pKa = 3.84GIYY104 pKa = 10.3EE105 pKa = 4.01FQANYY110 pKa = 10.59SGLADD115 pKa = 3.36VTVSVEE121 pKa = 3.77LTNAIEE127 pKa = 4.11TSEE130 pKa = 4.15TGTAEE135 pKa = 3.75TGTAVIGTAVTGTGEE150 pKa = 4.16AGTDD154 pKa = 3.1EE155 pKa = 4.19VSFYY159 pKa = 11.4KK160 pKa = 10.66LAPGQIEE167 pKa = 4.06YY168 pKa = 10.45DD169 pKa = 3.6ITCNASPAFFANADD183 pKa = 3.71DD184 pKa = 4.41DD185 pKa = 5.48SIVILLDD192 pKa = 3.49ATDD195 pKa = 5.21DD196 pKa = 4.76GILTITLHH204 pKa = 7.28DD205 pKa = 4.14EE206 pKa = 4.52LIKK209 pKa = 10.98PFDD212 pKa = 4.67DD213 pKa = 3.66GTFVVIVDD221 pKa = 3.83NQVMQDD227 pKa = 3.15FTQIGNTLTIPCLAGTEE244 pKa = 4.24KK245 pKa = 10.5IEE247 pKa = 4.42IHH249 pKa = 6.32GSWAIPEE256 pKa = 4.3FGVIAAMILAVAIISIIVVTAKK278 pKa = 9.5TRR280 pKa = 11.84LSIVPRR286 pKa = 11.84YY287 pKa = 9.45
Molecular weight: 30.31 kDa
Isoelectric point according different methods:
Protein with the highest isoelectric point:
>tr|A0A329CX59|A0A329CX59_9ARCH Uncharacterized protein OS=Thaumarchaeota archaeon SCGC AC-337_F14 OX=1465461 GN=BGW87_10233 PE=4 SV=1
MM1 pKa = 7.19ATSKK5 pKa = 10.86AKK7 pKa = 10.44RR8 pKa = 11.84SAAAKK13 pKa = 9.55KK14 pKa = 9.82AARR17 pKa = 11.84TRR19 pKa = 11.84KK20 pKa = 9.74RR21 pKa = 11.84NAAAKK26 pKa = 7.03NTKK29 pKa = 9.94RR30 pKa = 11.84SAASKK35 pKa = 9.79RR36 pKa = 11.84RR37 pKa = 11.84KK38 pKa = 9.71SSGGAKK44 pKa = 9.67RR45 pKa = 11.84KK46 pKa = 9.35APKK49 pKa = 10.05RR50 pKa = 11.84KK51 pKa = 9.13APKK54 pKa = 9.96RR55 pKa = 11.84KK56 pKa = 7.59ATKK59 pKa = 10.2RR60 pKa = 11.84KK61 pKa = 6.9ATKK64 pKa = 10.12RR65 pKa = 11.84KK66 pKa = 8.78APKK69 pKa = 9.87RR70 pKa = 11.84KK71 pKa = 9.21APKK74 pKa = 9.6RR75 pKa = 11.84KK76 pKa = 8.99AAAKK80 pKa = 9.59RR81 pKa = 11.84RR82 pKa = 11.84RR83 pKa = 11.84RR84 pKa = 3.55
MM1 pKa = 7.19ATSKK5 pKa = 10.86AKK7 pKa = 10.44RR8 pKa = 11.84SAAAKK13 pKa = 9.55KK14 pKa = 9.82AARR17 pKa = 11.84TRR19 pKa = 11.84KK20 pKa = 9.74RR21 pKa = 11.84NAAAKK26 pKa = 7.03NTKK29 pKa = 9.94RR30 pKa = 11.84SAASKK35 pKa = 9.79RR36 pKa = 11.84RR37 pKa = 11.84KK38 pKa = 9.71SSGGAKK44 pKa = 9.67RR45 pKa = 11.84KK46 pKa = 9.35APKK49 pKa = 10.05RR50 pKa = 11.84KK51 pKa = 9.13APKK54 pKa = 9.96RR55 pKa = 11.84KK56 pKa = 7.59ATKK59 pKa = 10.2RR60 pKa = 11.84KK61 pKa = 6.9ATKK64 pKa = 10.12RR65 pKa = 11.84KK66 pKa = 8.78APKK69 pKa = 9.87RR70 pKa = 11.84KK71 pKa = 9.21APKK74 pKa = 9.6RR75 pKa = 11.84KK76 pKa = 8.99AAAKK80 pKa = 9.59RR81 pKa = 11.84RR82 pKa = 11.84RR83 pKa = 11.84RR84 pKa = 3.55
Molecular weight: 9.36 kDa
Isoelectric point according different methods:
Peptides (in silico digests for buttom-up proteomics)
Below you can find in silico digests of the whole proteome with Trypsin, Chymotrypsin, Trypsin+LysC, LysN, ArgC proteases suitable for different mass spec machines.| Try ESI |
 |
|---|
| ChTry ESI |
|
|---|
| ArgC ESI |
|
|---|
| LysN ESI |
|
|---|
| TryLysC ESI |
|
|---|
| Try MALDI |
|
|---|
| ChTry MALDI |
|
|---|
| ArgC MALDI |
|
|---|
| LysN MALDI |
|
|---|
| TryLysC MALDI |
|
|---|
| Try LTQ |
|
|---|
| ChTry LTQ |
|
|---|
| ArgC LTQ |
|
|---|
| LysN LTQ |
|
|---|
| TryLysC LTQ |
|
|---|
| Try MSlow |
|
|---|
| ChTry MSlow |
|
|---|
| ArgC MSlow |
|
|---|
| LysN MSlow |
|
|---|
| TryLysC MSlow |
|
|---|
| Try MShigh |
|
|---|
| ChTry MShigh |
|
|---|
| ArgC MShigh |
|
|---|
| LysN MShigh |
|
|---|
| TryLysC MShigh |
|
|---|
General Statistics
Number of major isoforms |
Number of additional isoforms |
Number of all proteins |
Number of amino acids |
Min. Seq. Length |
Max. Seq. Length |
Avg. Seq. Length |
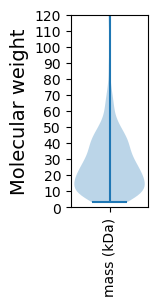
Avg. Mol. Weight |
|---|---|---|---|---|---|---|---|
0 |
139431 |
26 |
1264 |
249.0 |
28.05 |
Amino acid frequency
Ala |
Cys |
Asp |
Glu |
Phe |
Gly |
His |
Ile |
Lys |
Leu |
|---|---|---|---|---|---|---|---|---|---|
5.738 ± 0.09 | 1.11 ± 0.039 |
5.898 ± 0.068 | 6.987 ± 0.094 |
4.277 ± 0.08 | 6.341 ± 0.096 |
1.87 ± 0.038 | 8.784 ± 0.096 |
9.286 ± 0.134 | 8.753 ± 0.086 |
Met |
Asn |
Gln |
Pro |
Arg |
Ser |
Thr |
Val |
Trp |
Tyr |
|---|---|---|---|---|---|---|---|---|---|
2.454 ± 0.048 | 5.109 ± 0.079 |
3.667 ± 0.053 | 3.037 ± 0.054 |
3.924 ± 0.076 | 6.909 ± 0.088 |
5.389 ± 0.068 | 6.346 ± 0.079 |
0.928 ± 0.041 | 3.192 ± 0.057 |
Most of the basic statistics you can see at this page can be downloaded from this CSV file
See this proteome in:

Proteome-pI is available under Creative Commons Attribution-NoDerivs license, for more details see here
| Reference: Kozlowski LP. Proteome-pI 2.0: Proteome Isoelectric Point Database Update. Nucleic Acids Res. 2021, doi: 10.1093/nar/gkab944 | Contact: Lukasz P. Kozlowski |