Virgibacillus phage Mimir87
Taxonomy: Viruses; Duplodnaviria; Heunggongvirae; Uroviricota; Caudoviricetes; Caudovirales; Siphoviridae; unclassified Siphoviridae
Average proteome isoelectric point is 6.14
Get precalculated fractions of proteins
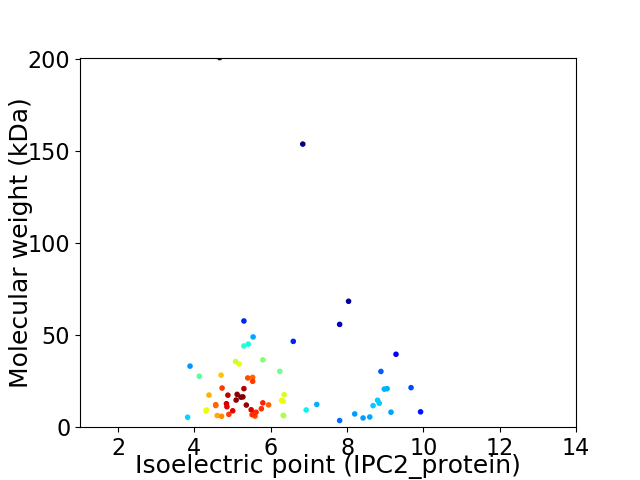
Virtual 2D-PAGE plot for 68 proteins (isoelectric point calculated using IPC2_protein)
Get csv file with sequences according to given criteria:
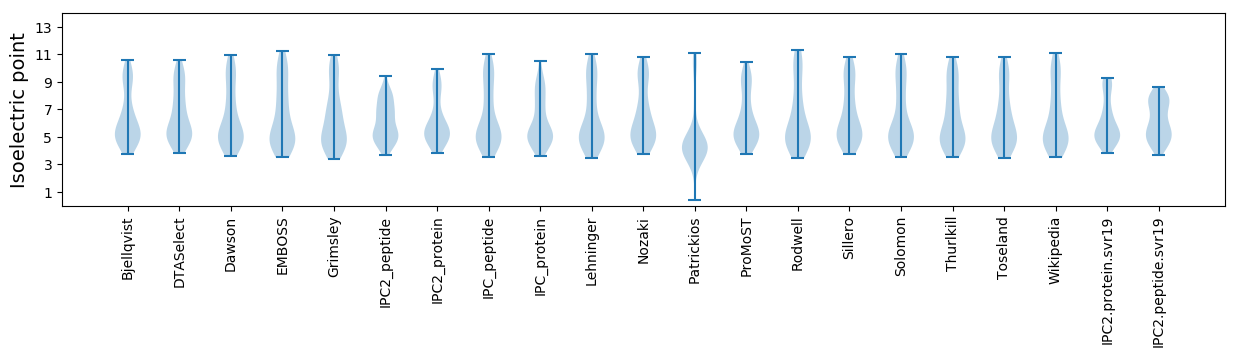
* You can choose from 21 different methods for calculating isoelectric point
Summary statistics related to proteome-wise predictions
Protein with the lowest isoelectric point:
>tr|A0A482IJT7|A0A482IJT7_9CAUD Replication protein O OS=Virgibacillus phage Mimir87 OX=2530052 PE=4 SV=1
MM1 pKa = 7.67EE2 pKa = 5.7EE3 pKa = 3.83IKK5 pKa = 10.39QLRR8 pKa = 11.84EE9 pKa = 3.42WMLDD13 pKa = 2.97SNYY16 pKa = 9.81PVEE19 pKa = 5.19AVALMSDD26 pKa = 3.75EE27 pKa = 4.31EE28 pKa = 4.7VVAEE32 pKa = 4.13YY33 pKa = 10.63EE34 pKa = 4.3AVTGDD39 pKa = 3.89YY40 pKa = 9.99STVSPIYY47 pKa = 10.54
MM1 pKa = 7.67EE2 pKa = 5.7EE3 pKa = 3.83IKK5 pKa = 10.39QLRR8 pKa = 11.84EE9 pKa = 3.42WMLDD13 pKa = 2.97SNYY16 pKa = 9.81PVEE19 pKa = 5.19AVALMSDD26 pKa = 3.75EE27 pKa = 4.31EE28 pKa = 4.7VVAEE32 pKa = 4.13YY33 pKa = 10.63EE34 pKa = 4.3AVTGDD39 pKa = 3.89YY40 pKa = 9.99STVSPIYY47 pKa = 10.54
Molecular weight: 5.4 kDa
Isoelectric point according different methods:
Protein with the highest isoelectric point:
>tr|A0A482IFB4|A0A482IFB4_9CAUD Uncharacterized protein OS=Virgibacillus phage Mimir87 OX=2530052 PE=4 SV=1
MM1 pKa = 7.6KK2 pKa = 10.47KK3 pKa = 10.32LFNRR7 pKa = 11.84SVQRR11 pKa = 11.84KK12 pKa = 5.45EE13 pKa = 4.01RR14 pKa = 11.84IMIFYY19 pKa = 9.92IDD21 pKa = 3.8SNNNVTQRR29 pKa = 11.84IIKK32 pKa = 9.25VISIEE37 pKa = 4.07EE38 pKa = 4.0SSVIAFCYY46 pKa = 8.92YY47 pKa = 9.63RR48 pKa = 11.84KK49 pKa = 9.84KK50 pKa = 10.96VRR52 pKa = 11.84TFKK55 pKa = 10.83LSNILSVGPITKK67 pKa = 10.1RR68 pKa = 11.84VGAA71 pKa = 4.46
MM1 pKa = 7.6KK2 pKa = 10.47KK3 pKa = 10.32LFNRR7 pKa = 11.84SVQRR11 pKa = 11.84KK12 pKa = 5.45EE13 pKa = 4.01RR14 pKa = 11.84IMIFYY19 pKa = 9.92IDD21 pKa = 3.8SNNNVTQRR29 pKa = 11.84IIKK32 pKa = 9.25VISIEE37 pKa = 4.07EE38 pKa = 4.0SSVIAFCYY46 pKa = 8.92YY47 pKa = 9.63RR48 pKa = 11.84KK49 pKa = 9.84KK50 pKa = 10.96VRR52 pKa = 11.84TFKK55 pKa = 10.83LSNILSVGPITKK67 pKa = 10.1RR68 pKa = 11.84VGAA71 pKa = 4.46
Molecular weight: 8.34 kDa
Isoelectric point according different methods:
Peptides (in silico digests for buttom-up proteomics)
Below you can find in silico digests of the whole proteome with Trypsin, Chymotrypsin, Trypsin+LysC, LysN, ArgC proteases suitable for different mass spec machines.| Try ESI |
 |
|---|
| ChTry ESI |
|
|---|
| ArgC ESI |
|
|---|
| LysN ESI |
|
|---|
| TryLysC ESI |
|
|---|
| Try MALDI |
|
|---|
| ChTry MALDI |
|
|---|
| ArgC MALDI |
|
|---|
| LysN MALDI |
|
|---|
| TryLysC MALDI |
|
|---|
| Try LTQ |
|
|---|
| ChTry LTQ |
|
|---|
| ArgC LTQ |
|
|---|
| LysN LTQ |
|
|---|
| TryLysC LTQ |
|
|---|
| Try MSlow |
|
|---|
| ChTry MSlow |
|
|---|
| ArgC MSlow |
|
|---|
| LysN MSlow |
|
|---|
| TryLysC MSlow |
|
|---|
| Try MShigh |
|
|---|
| ChTry MShigh |
|
|---|
| ArgC MShigh |
|
|---|
| LysN MShigh |
|
|---|
| TryLysC MShigh |
|
|---|
General Statistics
Number of major isoforms |
Number of additional isoforms |
Number of all proteins |
Number of amino acids |
Min. Seq. Length |
Max. Seq. Length |
Avg. Seq. Length |
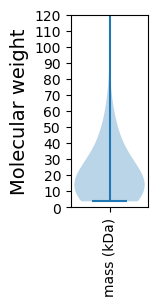
Avg. Mol. Weight |
|---|---|---|---|---|---|---|---|
0 |
14519 |
31 |
1790 |
213.5 |
24.2 |
Amino acid frequency
Ala |
Cys |
Asp |
Glu |
Phe |
Gly |
His |
Ile |
Lys |
Leu |
|---|---|---|---|---|---|---|---|---|---|
6.646 ± 0.488 | 0.641 ± 0.124 |
6.963 ± 0.312 | 8.093 ± 0.36 |
3.829 ± 0.245 | 6.433 ± 0.386 |
1.763 ± 0.123 | 6.509 ± 0.247 |
8.961 ± 0.436 | 8.079 ± 0.224 |
Met |
Asn |
Gln |
Pro |
Arg |
Ser |
Thr |
Val |
Trp |
Tyr |
|---|---|---|---|---|---|---|---|---|---|
2.803 ± 0.194 | 5.682 ± 0.248 |
2.734 ± 0.205 | 3.891 ± 0.223 |
4.119 ± 0.238 | 6.206 ± 0.251 |
5.641 ± 0.229 | 6.006 ± 0.271 |
1.081 ± 0.111 | 3.919 ± 0.225 |
Most of the basic statistics you can see at this page can be downloaded from this CSV file
See this proteome in:

Proteome-pI is available under Creative Commons Attribution-NoDerivs license, for more details see here
| Reference: Kozlowski LP. Proteome-pI 2.0: Proteome Isoelectric Point Database Update. Nucleic Acids Res. 2021, doi: 10.1093/nar/gkab944 | Contact: Lukasz P. Kozlowski |