Streptococcus phage Javan558
Taxonomy: Viruses; Duplodnaviria; Heunggongvirae; Uroviricota; Caudoviricetes; Caudovirales; Siphoviridae; unclassified Siphoviridae
Average proteome isoelectric point is 6.06
Get precalculated fractions of proteins
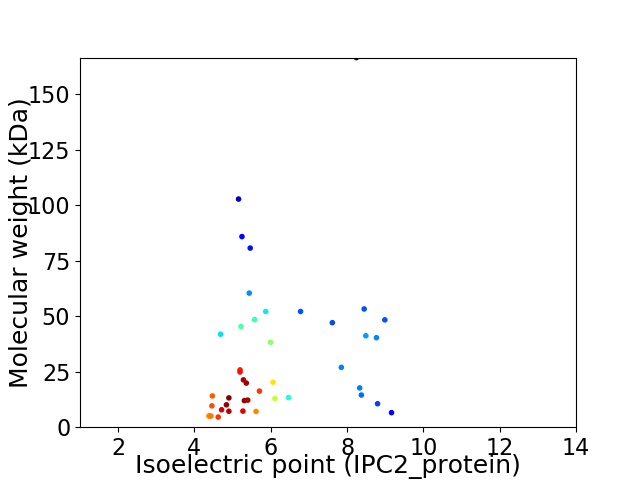
Virtual 2D-PAGE plot for 43 proteins (isoelectric point calculated using IPC2_protein)
Get csv file with sequences according to given criteria:
* You can choose from 21 different methods for calculating isoelectric point
Summary statistics related to proteome-wise predictions
Protein with the lowest isoelectric point:
>tr|A0A4D6BA70|A0A4D6BA70_9CAUD DNA primase/helicase OS=Streptococcus phage Javan558 OX=2548257 GN=Javan558_0036 PE=4 SV=1
MM1 pKa = 8.31DD2 pKa = 6.03DD3 pKa = 3.65PHH5 pKa = 6.88PVPKK9 pKa = 9.65GTLGTVIGVDD19 pKa = 4.24DD20 pKa = 4.44IGSLLVKK27 pKa = 9.7WEE29 pKa = 4.24NGSCLNVLYY38 pKa = 10.78GIDD41 pKa = 3.27IVEE44 pKa = 4.24KK45 pKa = 11.13VMM47 pKa = 4.89
MM1 pKa = 8.31DD2 pKa = 6.03DD3 pKa = 3.65PHH5 pKa = 6.88PVPKK9 pKa = 9.65GTLGTVIGVDD19 pKa = 4.24DD20 pKa = 4.44IGSLLVKK27 pKa = 9.7WEE29 pKa = 4.24NGSCLNVLYY38 pKa = 10.78GIDD41 pKa = 3.27IVEE44 pKa = 4.24KK45 pKa = 11.13VMM47 pKa = 4.89
Molecular weight: 5.04 kDa
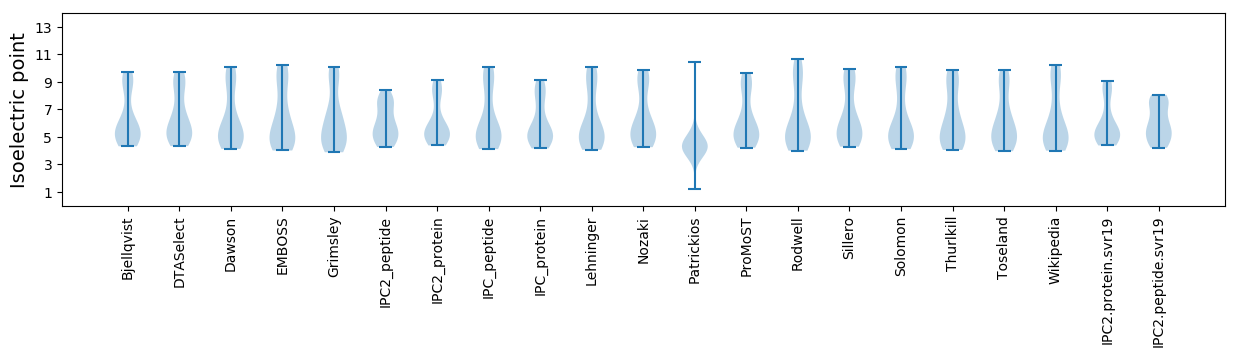
Isoelectric point according different methods:
Protein with the highest isoelectric point:
>tr|A0A4D6BBE0|A0A4D6BBE0_9CAUD Endopeptidase OS=Streptococcus phage Javan558 OX=2548257 GN=Javan558_0010 PE=4 SV=1
MM1 pKa = 7.72MYY3 pKa = 10.16TILTCTIMGLWVLIGLYY20 pKa = 9.77FGYY23 pKa = 8.1MTIRR27 pKa = 11.84DD28 pKa = 4.34DD29 pKa = 3.23IRR31 pKa = 11.84NEE33 pKa = 3.63IEE35 pKa = 4.98RR36 pKa = 11.84KK37 pKa = 9.56AKK39 pKa = 9.28QNKK42 pKa = 8.32EE43 pKa = 4.09KK44 pKa = 10.83LSQTPLSRR52 pKa = 11.84KK53 pKa = 9.46NKK55 pKa = 9.68
MM1 pKa = 7.72MYY3 pKa = 10.16TILTCTIMGLWVLIGLYY20 pKa = 9.77FGYY23 pKa = 8.1MTIRR27 pKa = 11.84DD28 pKa = 4.34DD29 pKa = 3.23IRR31 pKa = 11.84NEE33 pKa = 3.63IEE35 pKa = 4.98RR36 pKa = 11.84KK37 pKa = 9.56AKK39 pKa = 9.28QNKK42 pKa = 8.32EE43 pKa = 4.09KK44 pKa = 10.83LSQTPLSRR52 pKa = 11.84KK53 pKa = 9.46NKK55 pKa = 9.68
Molecular weight: 6.55 kDa
Isoelectric point according different methods:
Peptides (in silico digests for buttom-up proteomics)
Below you can find in silico digests of the whole proteome with Trypsin, Chymotrypsin, Trypsin+LysC, LysN, ArgC proteases suitable for different mass spec machines.| Try ESI |
 |
|---|
| ChTry ESI |
|
|---|
| ArgC ESI |
|
|---|
| LysN ESI |
|
|---|
| TryLysC ESI |
|
|---|
| Try MALDI |
|
|---|
| ChTry MALDI |
|
|---|
| ArgC MALDI |
|
|---|
| LysN MALDI |
|
|---|
| TryLysC MALDI |
|
|---|
| Try LTQ |
|
|---|
| ChTry LTQ |
|
|---|
| ArgC LTQ |
|
|---|
| LysN LTQ |
|
|---|
| TryLysC LTQ |
|
|---|
| Try MSlow |
|
|---|
| ChTry MSlow |
|
|---|
| ArgC MSlow |
|
|---|
| LysN MSlow |
|
|---|
| TryLysC MSlow |
|
|---|
| Try MShigh |
|
|---|
| ChTry MShigh |
|
|---|
| ArgC MShigh |
|
|---|
| LysN MShigh |
|
|---|
| TryLysC MShigh |
|
|---|
General Statistics
Number of major isoforms |
Number of additional isoforms |
Number of all proteins |
Number of amino acids |
Min. Seq. Length |
Max. Seq. Length |
Avg. Seq. Length |
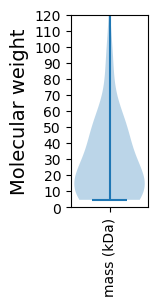
Avg. Mol. Weight |
|---|---|---|---|---|---|---|---|
0 |
12035 |
41 |
1515 |
279.9 |
31.53 |
Amino acid frequency
Ala |
Cys |
Asp |
Glu |
Phe |
Gly |
His |
Ile |
Lys |
Leu |
|---|---|---|---|---|---|---|---|---|---|
6.813 ± 0.461 | 0.806 ± 0.152 |
5.883 ± 0.303 | 7.179 ± 0.46 |
3.689 ± 0.221 | 6.689 ± 0.308 |
1.886 ± 0.121 | 6.456 ± 0.315 |
7.279 ± 0.274 | 9.007 ± 0.325 |
Met |
Asn |
Gln |
Pro |
Arg |
Ser |
Thr |
Val |
Trp |
Tyr |
|---|---|---|---|---|---|---|---|---|---|
2.268 ± 0.215 | 4.612 ± 0.198 |
3.016 ± 0.211 | 4.678 ± 0.252 |
4.769 ± 0.269 | 6.722 ± 0.382 |
6.747 ± 0.541 | 6.489 ± 0.236 |
1.404 ± 0.091 | 3.606 ± 0.3 |
Most of the basic statistics you can see at this page can be downloaded from this CSV file
See this proteome in:

Proteome-pI is available under Creative Commons Attribution-NoDerivs license, for more details see here
| Reference: Kozlowski LP. Proteome-pI 2.0: Proteome Isoelectric Point Database Update. Nucleic Acids Res. 2021, doi: 10.1093/nar/gkab944 | Contact: Lukasz P. Kozlowski |