Okibacterium fritillariae
Taxonomy: cellular organisms; Bacteria; Terrabacteria group; Actinobacteria; Actinomycetia; Micrococcales; Microbacteriaceae; Okibacterium
Average proteome isoelectric point is 5.98
Get precalculated fractions of proteins
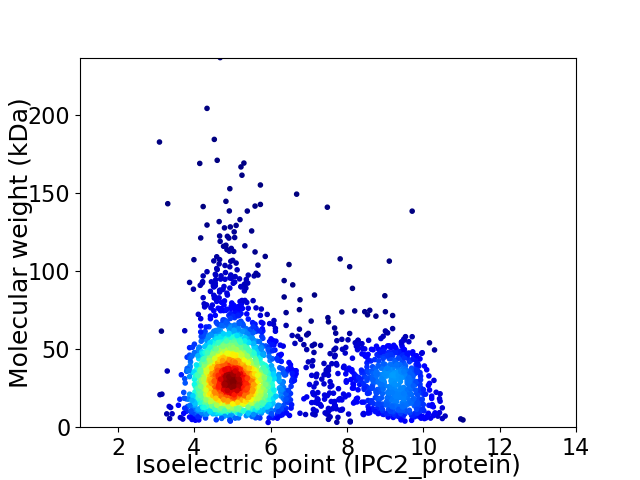
Virtual 2D-PAGE plot for 2806 proteins (isoelectric point calculated using IPC2_protein)
Get csv file with sequences according to given criteria:
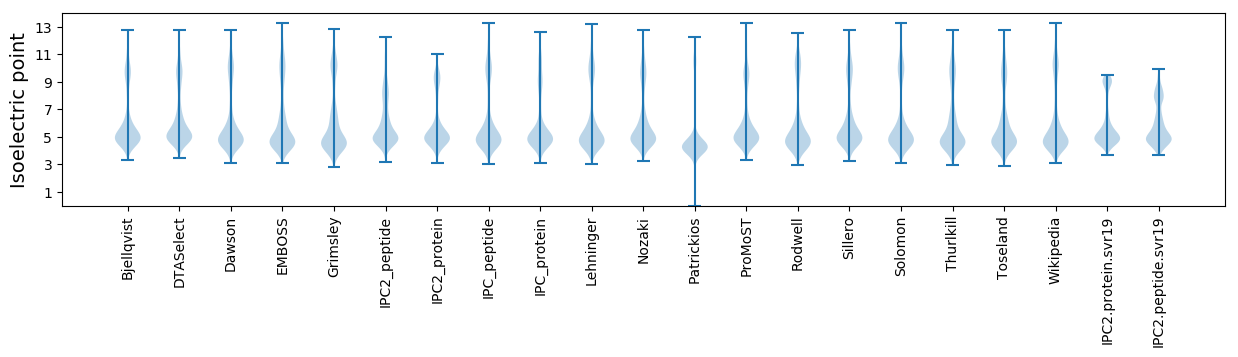
* You can choose from 21 different methods for calculating isoelectric point
Summary statistics related to proteome-wise predictions
Protein with the lowest isoelectric point:
>tr|A0A1T5KWD8|A0A1T5KWD8_9MICO Antibiotic biosynthesis monooxygenase OS=Okibacterium fritillariae OX=123320 GN=SAMN06309945_2552 PE=4 SV=1
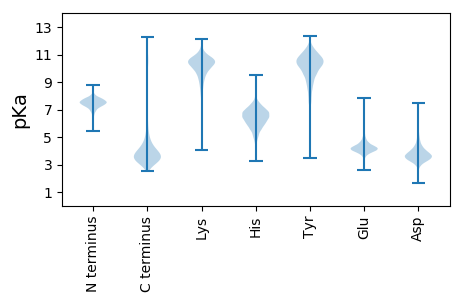
MM1 pKa = 7.91RR2 pKa = 11.84EE3 pKa = 3.34RR4 pKa = 11.84GARR7 pKa = 11.84AGARR11 pKa = 11.84AGSGIGATRR20 pKa = 11.84RR21 pKa = 11.84ADD23 pKa = 3.21ARR25 pKa = 11.84AISALAVLAAGALALTACSGAGSGDD50 pKa = 3.2GSGGDD55 pKa = 3.67TEE57 pKa = 5.35APASATPAFAIDD69 pKa = 4.07QDD71 pKa = 4.25FPDD74 pKa = 4.86PDD76 pKa = 3.63VLRR79 pKa = 11.84VGDD82 pKa = 3.92TYY84 pKa = 11.5YY85 pKa = 11.15AYY87 pKa = 9.46ATNSPAANLQYY98 pKa = 10.31ATSTDD103 pKa = 3.6LEE105 pKa = 4.51TWQVAGDD112 pKa = 4.0DD113 pKa = 4.47AFPDD117 pKa = 3.89LPAWADD123 pKa = 3.72EE124 pKa = 4.09GRR126 pKa = 11.84TWAPDD131 pKa = 3.34VTEE134 pKa = 4.29LADD137 pKa = 4.1GRR139 pKa = 11.84FALYY143 pKa = 8.05FTAQDD148 pKa = 3.57AEE150 pKa = 4.58SGQQCIGAATADD162 pKa = 3.8APTGPFVGASDD173 pKa = 4.06TPLLCPLDD181 pKa = 3.77EE182 pKa = 5.38GGAIDD187 pKa = 5.05ASSFTDD193 pKa = 3.25TDD195 pKa = 3.61GARR198 pKa = 11.84YY199 pKa = 8.93LVWKK203 pKa = 10.63NDD205 pKa = 3.68GNCCGLDD212 pKa = 2.93TWLQLSPLGADD223 pKa = 3.52GVTLAGEE230 pKa = 4.33PTRR233 pKa = 11.84LLQQTEE239 pKa = 3.8AWEE242 pKa = 4.8GSLIEE247 pKa = 4.29APVIVKK253 pKa = 10.29HH254 pKa = 6.73DD255 pKa = 3.73DD256 pKa = 3.73SYY258 pKa = 12.13VLFYY262 pKa = 10.95SANDD266 pKa = 3.73YY267 pKa = 11.26GGEE270 pKa = 4.11AYY272 pKa = 8.77ATGYY276 pKa = 8.43ATATALAGPYY286 pKa = 8.76TKK288 pKa = 10.77ADD290 pKa = 3.6GPLLTTEE297 pKa = 4.28ITDD300 pKa = 3.61DD301 pKa = 4.05AYY303 pKa = 11.29VGPGGQDD310 pKa = 3.05VVAGPDD316 pKa = 3.23GKK318 pKa = 10.66DD319 pKa = 2.68RR320 pKa = 11.84IFFHH324 pKa = 6.58SWDD327 pKa = 3.39PAIVYY332 pKa = 10.19RR333 pKa = 11.84GMNVLPLSWNGSTPVVDD350 pKa = 5.3LPP352 pKa = 4.44
MM1 pKa = 7.91RR2 pKa = 11.84EE3 pKa = 3.34RR4 pKa = 11.84GARR7 pKa = 11.84AGARR11 pKa = 11.84AGSGIGATRR20 pKa = 11.84RR21 pKa = 11.84ADD23 pKa = 3.21ARR25 pKa = 11.84AISALAVLAAGALALTACSGAGSGDD50 pKa = 3.2GSGGDD55 pKa = 3.67TEE57 pKa = 5.35APASATPAFAIDD69 pKa = 4.07QDD71 pKa = 4.25FPDD74 pKa = 4.86PDD76 pKa = 3.63VLRR79 pKa = 11.84VGDD82 pKa = 3.92TYY84 pKa = 11.5YY85 pKa = 11.15AYY87 pKa = 9.46ATNSPAANLQYY98 pKa = 10.31ATSTDD103 pKa = 3.6LEE105 pKa = 4.51TWQVAGDD112 pKa = 4.0DD113 pKa = 4.47AFPDD117 pKa = 3.89LPAWADD123 pKa = 3.72EE124 pKa = 4.09GRR126 pKa = 11.84TWAPDD131 pKa = 3.34VTEE134 pKa = 4.29LADD137 pKa = 4.1GRR139 pKa = 11.84FALYY143 pKa = 8.05FTAQDD148 pKa = 3.57AEE150 pKa = 4.58SGQQCIGAATADD162 pKa = 3.8APTGPFVGASDD173 pKa = 4.06TPLLCPLDD181 pKa = 3.77EE182 pKa = 5.38GGAIDD187 pKa = 5.05ASSFTDD193 pKa = 3.25TDD195 pKa = 3.61GARR198 pKa = 11.84YY199 pKa = 8.93LVWKK203 pKa = 10.63NDD205 pKa = 3.68GNCCGLDD212 pKa = 2.93TWLQLSPLGADD223 pKa = 3.52GVTLAGEE230 pKa = 4.33PTRR233 pKa = 11.84LLQQTEE239 pKa = 3.8AWEE242 pKa = 4.8GSLIEE247 pKa = 4.29APVIVKK253 pKa = 10.29HH254 pKa = 6.73DD255 pKa = 3.73DD256 pKa = 3.73SYY258 pKa = 12.13VLFYY262 pKa = 10.95SANDD266 pKa = 3.73YY267 pKa = 11.26GGEE270 pKa = 4.11AYY272 pKa = 8.77ATGYY276 pKa = 8.43ATATALAGPYY286 pKa = 8.76TKK288 pKa = 10.77ADD290 pKa = 3.6GPLLTTEE297 pKa = 4.28ITDD300 pKa = 3.61DD301 pKa = 4.05AYY303 pKa = 11.29VGPGGQDD310 pKa = 3.05VVAGPDD316 pKa = 3.23GKK318 pKa = 10.66DD319 pKa = 2.68RR320 pKa = 11.84IFFHH324 pKa = 6.58SWDD327 pKa = 3.39PAIVYY332 pKa = 10.19RR333 pKa = 11.84GMNVLPLSWNGSTPVVDD350 pKa = 5.3LPP352 pKa = 4.44
Molecular weight: 36.4 kDa
Isoelectric point according different methods:
Protein with the highest isoelectric point:
>tr|A0A1T5IIS8|A0A1T5IIS8_9MICO Excinuclease ABC A subunit OS=Okibacterium fritillariae OX=123320 GN=SAMN06309945_0500 PE=4 SV=1
MM1 pKa = 7.58KK2 pKa = 10.04VRR4 pKa = 11.84SSIKK8 pKa = 10.0SLKK11 pKa = 8.77NQPGSQVVRR20 pKa = 11.84RR21 pKa = 11.84RR22 pKa = 11.84GRR24 pKa = 11.84VFVINKK30 pKa = 8.85LNPRR34 pKa = 11.84WKK36 pKa = 10.37GRR38 pKa = 11.84QGG40 pKa = 3.06
MM1 pKa = 7.58KK2 pKa = 10.04VRR4 pKa = 11.84SSIKK8 pKa = 10.0SLKK11 pKa = 8.77NQPGSQVVRR20 pKa = 11.84RR21 pKa = 11.84RR22 pKa = 11.84GRR24 pKa = 11.84VFVINKK30 pKa = 8.85LNPRR34 pKa = 11.84WKK36 pKa = 10.37GRR38 pKa = 11.84QGG40 pKa = 3.06
Molecular weight: 4.66 kDa
Isoelectric point according different methods:
Peptides (in silico digests for buttom-up proteomics)
Below you can find in silico digests of the whole proteome with Trypsin, Chymotrypsin, Trypsin+LysC, LysN, ArgC proteases suitable for different mass spec machines.| Try ESI |
 |
|---|
| ChTry ESI |
|
|---|
| ArgC ESI |
|
|---|
| LysN ESI |
|
|---|
| TryLysC ESI |
|
|---|
| Try MALDI |
|
|---|
| ChTry MALDI |
|
|---|
| ArgC MALDI |
|
|---|
| LysN MALDI |
|
|---|
| TryLysC MALDI |
|
|---|
| Try LTQ |
|
|---|
| ChTry LTQ |
|
|---|
| ArgC LTQ |
|
|---|
| LysN LTQ |
|
|---|
| TryLysC LTQ |
|
|---|
| Try MSlow |
|
|---|
| ChTry MSlow |
|
|---|
| ArgC MSlow |
|
|---|
| LysN MSlow |
|
|---|
| TryLysC MSlow |
|
|---|
| Try MShigh |
|
|---|
| ChTry MShigh |
|
|---|
| ArgC MShigh |
|
|---|
| LysN MShigh |
|
|---|
| TryLysC MShigh |
|
|---|
General Statistics
Number of major isoforms |
Number of additional isoforms |
Number of all proteins |
Number of amino acids |
Min. Seq. Length |
Max. Seq. Length |
Avg. Seq. Length |
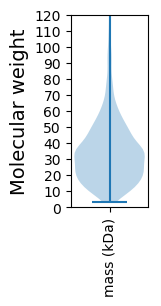
Avg. Mol. Weight |
|---|---|---|---|---|---|---|---|
0 |
947544 |
29 |
2226 |
337.7 |
36.04 |
Amino acid frequency
Ala |
Cys |
Asp |
Glu |
Phe |
Gly |
His |
Ile |
Lys |
Leu |
|---|---|---|---|---|---|---|---|---|---|
13.086 ± 0.066 | 0.432 ± 0.01 |
6.395 ± 0.061 | 5.429 ± 0.047 |
3.204 ± 0.034 | 8.844 ± 0.044 |
1.867 ± 0.023 | 4.697 ± 0.038 |
2.3 ± 0.034 | 9.809 ± 0.051 |
Met |
Asn |
Gln |
Pro |
Arg |
Ser |
Thr |
Val |
Trp |
Tyr |
|---|---|---|---|---|---|---|---|---|---|
1.65 ± 0.015 | 2.329 ± 0.027 |
5.458 ± 0.037 | 2.973 ± 0.029 |
6.687 ± 0.054 | 6.254 ± 0.035 |
6.465 ± 0.045 | 8.713 ± 0.041 |
1.391 ± 0.02 | 2.017 ± 0.023 |
Most of the basic statistics you can see at this page can be downloaded from this CSV file
See this proteome in:

Proteome-pI is available under Creative Commons Attribution-NoDerivs license, for more details see here
| Reference: Kozlowski LP. Proteome-pI 2.0: Proteome Isoelectric Point Database Update. Nucleic Acids Res. 2021, doi: 10.1093/nar/gkab944 | Contact: Lukasz P. Kozlowski |