Thiomicrorhabdus sediminis
Taxonomy: cellular organisms; Bacteria; Proteobacteria; Gammaproteobacteria; Thiotrichales; Piscirickettsiaceae; Thiomicrorhabdus
Average proteome isoelectric point is 6.0
Get precalculated fractions of proteins
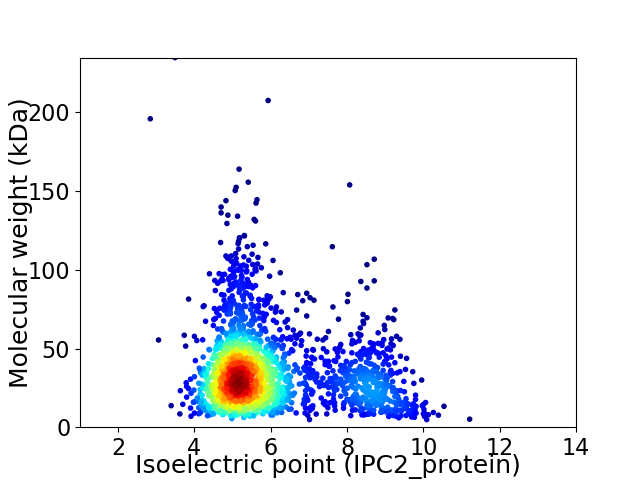
Virtual 2D-PAGE plot for 2078 proteins (isoelectric point calculated using IPC2_protein)
Get csv file with sequences according to given criteria:
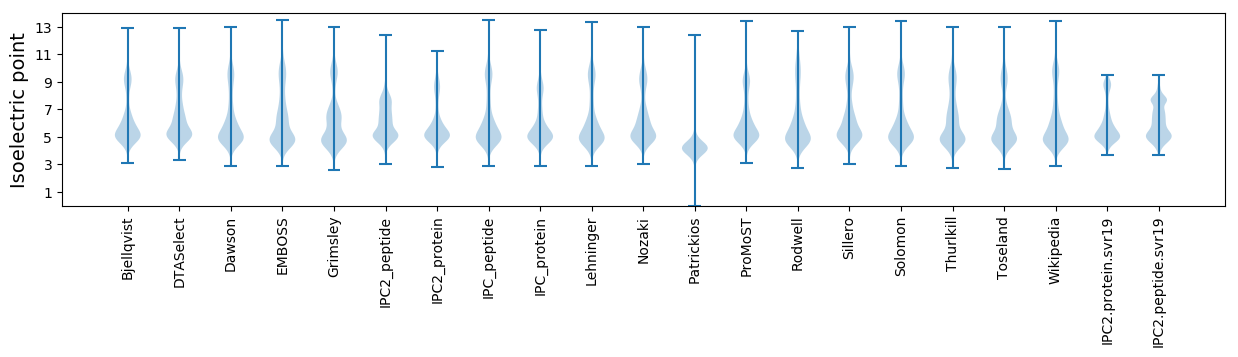
* You can choose from 21 different methods for calculating isoelectric point
Summary statistics related to proteome-wise predictions
Protein with the lowest isoelectric point:
>tr|A0A4V1HI22|A0A4V1HI22_9GAMM Formate-dependent phosphoribosylglycinamide formyltransferase OS=Thiomicrorhabdus sediminis OX=2580412 GN=purT PE=3 SV=1
MM1 pKa = 7.73INRR4 pKa = 11.84SKK6 pKa = 10.83QGGFSLVEE14 pKa = 3.9MMVVLAILGILFVGVTEE31 pKa = 4.53GMKK34 pKa = 10.32SFQEE38 pKa = 4.27TEE40 pKa = 3.82LGKK43 pKa = 11.02SNNEE47 pKa = 3.67KK48 pKa = 10.68LDD50 pKa = 3.72LVKK53 pKa = 10.66QQLLKK58 pKa = 10.51FVQAEE63 pKa = 4.44KK64 pKa = 11.27YY65 pKa = 10.1LLCPDD70 pKa = 3.98SDD72 pKa = 3.74GDD74 pKa = 3.97GYY76 pKa = 10.7EE77 pKa = 3.83NRR79 pKa = 11.84TPSAVVIGTLGNVQACTVSYY99 pKa = 8.64GTVPYY104 pKa = 10.17RR105 pKa = 11.84DD106 pKa = 3.9LGLKK110 pKa = 9.96EE111 pKa = 4.13SQAVDD116 pKa = 2.68AWNNAIAYY124 pKa = 7.91AVNTQTTDD132 pKa = 2.91AQKK135 pKa = 10.5ICDD138 pKa = 3.75KK139 pKa = 10.98TEE141 pKa = 3.89AASMFCNLVPGVLWFSLADD160 pKa = 3.92TPPLAINRR168 pKa = 11.84GDD170 pKa = 3.31GNYY173 pKa = 9.84YY174 pKa = 9.18ICKK177 pKa = 10.14LGVAQCDD184 pKa = 3.36ATFVLDD190 pKa = 4.24SNNVLQDD197 pKa = 3.31ATVVLVAFNQTGQQAWDD214 pKa = 3.76DD215 pKa = 3.98CSEE218 pKa = 4.41LSTSQQEE225 pKa = 4.09NCDD228 pKa = 3.23ADD230 pKa = 4.98LYY232 pKa = 9.57YY233 pKa = 10.64QKK235 pKa = 10.61QSYY238 pKa = 10.54SSGGVIDD245 pKa = 5.6DD246 pKa = 5.31DD247 pKa = 4.84QIQTINGYY255 pKa = 7.6EE256 pKa = 3.98IKK258 pKa = 10.19ALAMGTVMTWNAFDD272 pKa = 4.18SASSAADD279 pKa = 3.34LTPTYY284 pKa = 10.4EE285 pKa = 4.45AFDD288 pKa = 3.49IAAGDD293 pKa = 4.25DD294 pKa = 3.75VSSLYY299 pKa = 11.14SSDD302 pKa = 3.4SDD304 pKa = 3.54VVMINHH310 pKa = 7.08DD311 pKa = 2.96VDD313 pKa = 3.43QAVRR317 pKa = 11.84LGNGDD322 pKa = 3.99DD323 pKa = 3.85YY324 pKa = 11.51MVIGNDD330 pKa = 3.25LNANANLALNKK341 pKa = 10.61GNDD344 pKa = 3.14SLYY347 pKa = 10.32IVGSSYY353 pKa = 11.86SNVNLGLGDD362 pKa = 3.67DD363 pKa = 4.05TMVLGGDD370 pKa = 3.58LTNNLSAQAGNDD382 pKa = 3.5RR383 pKa = 11.84VWIQGSVLSGSSLDD397 pKa = 3.78LGKK400 pKa = 10.3NDD402 pKa = 4.06DD403 pKa = 4.1VLWLGKK409 pKa = 9.91SDD411 pKa = 3.93NADD414 pKa = 3.15SGQIFTTLQGGDD426 pKa = 3.48GYY428 pKa = 11.15DD429 pKa = 2.54IVVFEE434 pKa = 4.94NQASWSDD441 pKa = 3.45LSASEE446 pKa = 4.78QSNLQNFEE454 pKa = 3.85LAIFKK459 pKa = 9.72TGSDD463 pKa = 3.58GGSGRR468 pKa = 11.84AYY470 pKa = 10.63CFLDD474 pKa = 4.23GSSPSCYY481 pKa = 10.65
MM1 pKa = 7.73INRR4 pKa = 11.84SKK6 pKa = 10.83QGGFSLVEE14 pKa = 3.9MMVVLAILGILFVGVTEE31 pKa = 4.53GMKK34 pKa = 10.32SFQEE38 pKa = 4.27TEE40 pKa = 3.82LGKK43 pKa = 11.02SNNEE47 pKa = 3.67KK48 pKa = 10.68LDD50 pKa = 3.72LVKK53 pKa = 10.66QQLLKK58 pKa = 10.51FVQAEE63 pKa = 4.44KK64 pKa = 11.27YY65 pKa = 10.1LLCPDD70 pKa = 3.98SDD72 pKa = 3.74GDD74 pKa = 3.97GYY76 pKa = 10.7EE77 pKa = 3.83NRR79 pKa = 11.84TPSAVVIGTLGNVQACTVSYY99 pKa = 8.64GTVPYY104 pKa = 10.17RR105 pKa = 11.84DD106 pKa = 3.9LGLKK110 pKa = 9.96EE111 pKa = 4.13SQAVDD116 pKa = 2.68AWNNAIAYY124 pKa = 7.91AVNTQTTDD132 pKa = 2.91AQKK135 pKa = 10.5ICDD138 pKa = 3.75KK139 pKa = 10.98TEE141 pKa = 3.89AASMFCNLVPGVLWFSLADD160 pKa = 3.92TPPLAINRR168 pKa = 11.84GDD170 pKa = 3.31GNYY173 pKa = 9.84YY174 pKa = 9.18ICKK177 pKa = 10.14LGVAQCDD184 pKa = 3.36ATFVLDD190 pKa = 4.24SNNVLQDD197 pKa = 3.31ATVVLVAFNQTGQQAWDD214 pKa = 3.76DD215 pKa = 3.98CSEE218 pKa = 4.41LSTSQQEE225 pKa = 4.09NCDD228 pKa = 3.23ADD230 pKa = 4.98LYY232 pKa = 9.57YY233 pKa = 10.64QKK235 pKa = 10.61QSYY238 pKa = 10.54SSGGVIDD245 pKa = 5.6DD246 pKa = 5.31DD247 pKa = 4.84QIQTINGYY255 pKa = 7.6EE256 pKa = 3.98IKK258 pKa = 10.19ALAMGTVMTWNAFDD272 pKa = 4.18SASSAADD279 pKa = 3.34LTPTYY284 pKa = 10.4EE285 pKa = 4.45AFDD288 pKa = 3.49IAAGDD293 pKa = 4.25DD294 pKa = 3.75VSSLYY299 pKa = 11.14SSDD302 pKa = 3.4SDD304 pKa = 3.54VVMINHH310 pKa = 7.08DD311 pKa = 2.96VDD313 pKa = 3.43QAVRR317 pKa = 11.84LGNGDD322 pKa = 3.99DD323 pKa = 3.85YY324 pKa = 11.51MVIGNDD330 pKa = 3.25LNANANLALNKK341 pKa = 10.61GNDD344 pKa = 3.14SLYY347 pKa = 10.32IVGSSYY353 pKa = 11.86SNVNLGLGDD362 pKa = 3.67DD363 pKa = 4.05TMVLGGDD370 pKa = 3.58LTNNLSAQAGNDD382 pKa = 3.5RR383 pKa = 11.84VWIQGSVLSGSSLDD397 pKa = 3.78LGKK400 pKa = 10.3NDD402 pKa = 4.06DD403 pKa = 4.1VLWLGKK409 pKa = 9.91SDD411 pKa = 3.93NADD414 pKa = 3.15SGQIFTTLQGGDD426 pKa = 3.48GYY428 pKa = 11.15DD429 pKa = 2.54IVVFEE434 pKa = 4.94NQASWSDD441 pKa = 3.45LSASEE446 pKa = 4.78QSNLQNFEE454 pKa = 3.85LAIFKK459 pKa = 9.72TGSDD463 pKa = 3.58GGSGRR468 pKa = 11.84AYY470 pKa = 10.63CFLDD474 pKa = 4.23GSSPSCYY481 pKa = 10.65
Molecular weight: 51.51 kDa
Isoelectric point according different methods:
Protein with the highest isoelectric point:
>tr|A0A4P9K332|A0A4P9K332_9GAMM Malonyl-[acyl-carrier protein] O-methyltransferase OS=Thiomicrorhabdus sediminis OX=2580412 GN=bioC PE=3 SV=1
MM1 pKa = 7.45KK2 pKa = 9.51RR3 pKa = 11.84TFQPSVIKK11 pKa = 10.49RR12 pKa = 11.84ARR14 pKa = 11.84THH16 pKa = 5.92GFRR19 pKa = 11.84ARR21 pKa = 11.84MATKK25 pKa = 10.37NGRR28 pKa = 11.84KK29 pKa = 9.16VLAARR34 pKa = 11.84RR35 pKa = 11.84AKK37 pKa = 9.76GRR39 pKa = 11.84KK40 pKa = 8.98RR41 pKa = 11.84LTVV44 pKa = 3.11
MM1 pKa = 7.45KK2 pKa = 9.51RR3 pKa = 11.84TFQPSVIKK11 pKa = 10.49RR12 pKa = 11.84ARR14 pKa = 11.84THH16 pKa = 5.92GFRR19 pKa = 11.84ARR21 pKa = 11.84MATKK25 pKa = 10.37NGRR28 pKa = 11.84KK29 pKa = 9.16VLAARR34 pKa = 11.84RR35 pKa = 11.84AKK37 pKa = 9.76GRR39 pKa = 11.84KK40 pKa = 8.98RR41 pKa = 11.84LTVV44 pKa = 3.11
Molecular weight: 5.11 kDa
Isoelectric point according different methods:
Peptides (in silico digests for buttom-up proteomics)
Below you can find in silico digests of the whole proteome with Trypsin, Chymotrypsin, Trypsin+LysC, LysN, ArgC proteases suitable for different mass spec machines.| Try ESI |
 |
|---|
| ChTry ESI |
|
|---|
| ArgC ESI |
|
|---|
| LysN ESI |
|
|---|
| TryLysC ESI |
|
|---|
| Try MALDI |
|
|---|
| ChTry MALDI |
|
|---|
| ArgC MALDI |
|
|---|
| LysN MALDI |
|
|---|
| TryLysC MALDI |
|
|---|
| Try LTQ |
|
|---|
| ChTry LTQ |
|
|---|
| ArgC LTQ |
|
|---|
| LysN LTQ |
|
|---|
| TryLysC LTQ |
|
|---|
| Try MSlow |
|
|---|
| ChTry MSlow |
|
|---|
| ArgC MSlow |
|
|---|
| LysN MSlow |
|
|---|
| TryLysC MSlow |
|
|---|
| Try MShigh |
|
|---|
| ChTry MShigh |
|
|---|
| ArgC MShigh |
|
|---|
| LysN MShigh |
|
|---|
| TryLysC MShigh |
|
|---|
General Statistics
Number of major isoforms |
Number of additional isoforms |
Number of all proteins |
Number of amino acids |
Min. Seq. Length |
Max. Seq. Length |
Avg. Seq. Length |
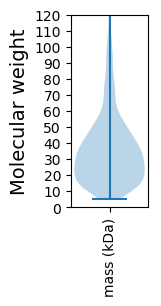
Avg. Mol. Weight |
|---|---|---|---|---|---|---|---|
0 |
695024 |
41 |
2244 |
334.5 |
37.3 |
Amino acid frequency
Ala |
Cys |
Asp |
Glu |
Phe |
Gly |
His |
Ile |
Lys |
Leu |
|---|---|---|---|---|---|---|---|---|---|
8.782 ± 0.064 | 0.856 ± 0.015 |
5.694 ± 0.048 | 6.44 ± 0.048 |
4.098 ± 0.038 | 6.465 ± 0.049 |
2.233 ± 0.029 | 6.588 ± 0.043 |
5.6 ± 0.04 | 10.439 ± 0.07 |
Met |
Asn |
Gln |
Pro |
Arg |
Ser |
Thr |
Val |
Trp |
Tyr |
|---|---|---|---|---|---|---|---|---|---|
2.772 ± 0.027 | 4.46 ± 0.039 |
3.761 ± 0.031 | 5.438 ± 0.064 |
4.289 ± 0.04 | 6.279 ± 0.043 |
4.871 ± 0.042 | 6.743 ± 0.048 |
1.203 ± 0.021 | 2.989 ± 0.028 |
Most of the basic statistics you can see at this page can be downloaded from this CSV file
See this proteome in:

Proteome-pI is available under Creative Commons Attribution-NoDerivs license, for more details see here
| Reference: Kozlowski LP. Proteome-pI 2.0: Proteome Isoelectric Point Database Update. Nucleic Acids Res. 2021, doi: 10.1093/nar/gkab944 | Contact: Lukasz P. Kozlowski |