Arthroderma benhamiae (strain ATCC MYA-4681 / CBS 112371) (Trichophyton mentagrophytes)
Taxonomy: cellular organisms; Eukaryota; Opisthokonta; Fungi; Dikarya; Ascomycota; saccharomyceta; Pezizomycotina; leotiomyceta; Eurotiomycetes; Eurotiomycetidae; Onygenales; Arthrodermataceae; Trichophyton; Trichophyton benhamiae
Average proteome isoelectric point is 6.63
Get precalculated fractions of proteins
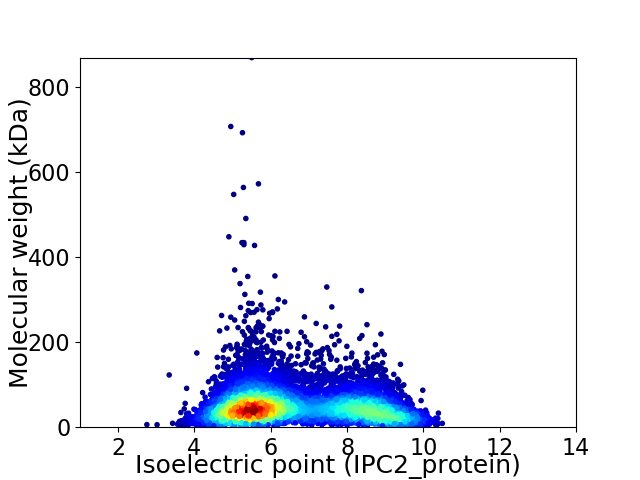
Virtual 2D-PAGE plot for 7976 proteins (isoelectric point calculated using IPC2_protein)
Get csv file with sequences according to given criteria:
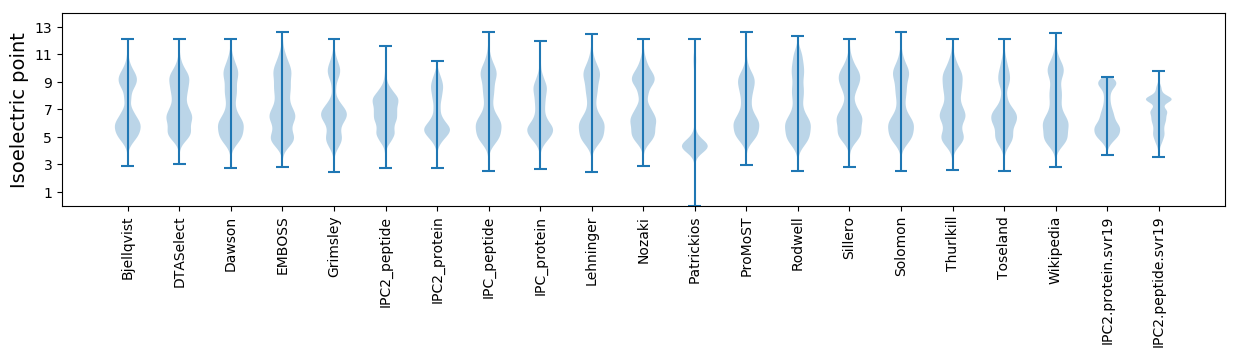
* You can choose from 21 different methods for calculating isoelectric point
Summary statistics related to proteome-wise predictions
Protein with the lowest isoelectric point:
>tr|D4AWL6|D4AWL6_ARTBC L-type lectin-like domain-containing protein OS=Arthroderma benhamiae (strain ATCC MYA-4681 / CBS 112371) OX=663331 GN=ARB_00582 PE=4 SV=1
MM1 pKa = 7.92DD2 pKa = 6.22PSPSDD7 pKa = 3.47EE8 pKa = 4.33NPDD11 pKa = 3.39YY12 pKa = 10.67KK13 pKa = 10.96QPGDD17 pKa = 3.72HH18 pKa = 7.43DD19 pKa = 4.2LTSGDD24 pKa = 4.04VEE26 pKa = 4.54NEE28 pKa = 4.06TLGDD32 pKa = 4.03DD33 pKa = 3.9YY34 pKa = 11.78CSDD37 pKa = 4.28FVNSQYY43 pKa = 10.64WPVLDD48 pKa = 5.89LPPLTNGSTRR58 pKa = 11.84GTNEE62 pKa = 3.15EE63 pKa = 4.72SFPQGHH69 pKa = 5.58QADD72 pKa = 4.99EE73 pKa = 4.36IYY75 pKa = 10.16EE76 pKa = 4.0YY77 pKa = 10.31PPRR80 pKa = 11.84HH81 pKa = 6.2IEE83 pKa = 4.47AGDD86 pKa = 3.44TGPPGTGSNLEE97 pKa = 4.55GVSTWQDD104 pKa = 2.12IDD106 pKa = 2.5IWRR109 pKa = 11.84NLTTIPP115 pKa = 4.33
MM1 pKa = 7.92DD2 pKa = 6.22PSPSDD7 pKa = 3.47EE8 pKa = 4.33NPDD11 pKa = 3.39YY12 pKa = 10.67KK13 pKa = 10.96QPGDD17 pKa = 3.72HH18 pKa = 7.43DD19 pKa = 4.2LTSGDD24 pKa = 4.04VEE26 pKa = 4.54NEE28 pKa = 4.06TLGDD32 pKa = 4.03DD33 pKa = 3.9YY34 pKa = 11.78CSDD37 pKa = 4.28FVNSQYY43 pKa = 10.64WPVLDD48 pKa = 5.89LPPLTNGSTRR58 pKa = 11.84GTNEE62 pKa = 3.15EE63 pKa = 4.72SFPQGHH69 pKa = 5.58QADD72 pKa = 4.99EE73 pKa = 4.36IYY75 pKa = 10.16EE76 pKa = 4.0YY77 pKa = 10.31PPRR80 pKa = 11.84HH81 pKa = 6.2IEE83 pKa = 4.47AGDD86 pKa = 3.44TGPPGTGSNLEE97 pKa = 4.55GVSTWQDD104 pKa = 2.12IDD106 pKa = 2.5IWRR109 pKa = 11.84NLTTIPP115 pKa = 4.33
Molecular weight: 12.72 kDa
Isoelectric point according different methods:
Protein with the highest isoelectric point:
>tr|D4AIW3|D4AIW3_ARTBC Cytochrome P450 putative OS=Arthroderma benhamiae (strain ATCC MYA-4681 / CBS 112371) OX=663331 GN=ARB_04211 PE=4 SV=1
MM1 pKa = 7.53AGVAAYY7 pKa = 9.42EE8 pKa = 3.99VDD10 pKa = 3.49AAAAAAVAAAAVVAVAVAVAAAAAAGRR37 pKa = 11.84KK38 pKa = 8.59KK39 pKa = 10.24RR40 pKa = 11.84RR41 pKa = 11.84QSQRR45 pKa = 11.84RR46 pKa = 11.84GDD48 pKa = 3.49PATASRR54 pKa = 11.84RR55 pKa = 11.84DD56 pKa = 3.59SEE58 pKa = 4.41PAGTASARR66 pKa = 11.84STAEE70 pKa = 3.74LPSWLLEE77 pKa = 3.92LLEE80 pKa = 4.73GQFSPSGGGSGAGNEE95 pKa = 4.69GAGSLCFRR103 pKa = 11.84GHH105 pKa = 6.9APWACWLAGLLAGWLAAGSRR125 pKa = 11.84DD126 pKa = 3.29LDD128 pKa = 3.52GRR130 pKa = 11.84RR131 pKa = 11.84KK132 pKa = 9.84GRR134 pKa = 11.84PGQGRR139 pKa = 11.84TEE141 pKa = 3.91GSEE144 pKa = 4.19RR145 pKa = 11.84ARR147 pKa = 11.84QDD149 pKa = 3.11GNGRR153 pKa = 11.84RR154 pKa = 11.84SRR156 pKa = 11.84GQDD159 pKa = 2.82GGRR162 pKa = 11.84EE163 pKa = 3.89GDD165 pKa = 3.54AVEE168 pKa = 3.91QRR170 pKa = 11.84QRR172 pKa = 11.84TSSRR176 pKa = 11.84AFCFFFFFFFVSSCRR191 pKa = 11.84FAVFFVSFAAKK202 pKa = 9.9KK203 pKa = 8.82PSPGGDD209 pKa = 2.83HH210 pKa = 6.2VTGFWSS216 pKa = 3.18
MM1 pKa = 7.53AGVAAYY7 pKa = 9.42EE8 pKa = 3.99VDD10 pKa = 3.49AAAAAAVAAAAVVAVAVAVAAAAAAGRR37 pKa = 11.84KK38 pKa = 8.59KK39 pKa = 10.24RR40 pKa = 11.84RR41 pKa = 11.84QSQRR45 pKa = 11.84RR46 pKa = 11.84GDD48 pKa = 3.49PATASRR54 pKa = 11.84RR55 pKa = 11.84DD56 pKa = 3.59SEE58 pKa = 4.41PAGTASARR66 pKa = 11.84STAEE70 pKa = 3.74LPSWLLEE77 pKa = 3.92LLEE80 pKa = 4.73GQFSPSGGGSGAGNEE95 pKa = 4.69GAGSLCFRR103 pKa = 11.84GHH105 pKa = 6.9APWACWLAGLLAGWLAAGSRR125 pKa = 11.84DD126 pKa = 3.29LDD128 pKa = 3.52GRR130 pKa = 11.84RR131 pKa = 11.84KK132 pKa = 9.84GRR134 pKa = 11.84PGQGRR139 pKa = 11.84TEE141 pKa = 3.91GSEE144 pKa = 4.19RR145 pKa = 11.84ARR147 pKa = 11.84QDD149 pKa = 3.11GNGRR153 pKa = 11.84RR154 pKa = 11.84SRR156 pKa = 11.84GQDD159 pKa = 2.82GGRR162 pKa = 11.84EE163 pKa = 3.89GDD165 pKa = 3.54AVEE168 pKa = 3.91QRR170 pKa = 11.84QRR172 pKa = 11.84TSSRR176 pKa = 11.84AFCFFFFFFFVSSCRR191 pKa = 11.84FAVFFVSFAAKK202 pKa = 9.9KK203 pKa = 8.82PSPGGDD209 pKa = 2.83HH210 pKa = 6.2VTGFWSS216 pKa = 3.18
Molecular weight: 22.46 kDa
Isoelectric point according different methods:
Peptides (in silico digests for buttom-up proteomics)
Below you can find in silico digests of the whole proteome with Trypsin, Chymotrypsin, Trypsin+LysC, LysN, ArgC proteases suitable for different mass spec machines.| Try ESI |
 |
|---|
| ChTry ESI |
|
|---|
| ArgC ESI |
|
|---|
| LysN ESI |
|
|---|
| TryLysC ESI |
|
|---|
| Try MALDI |
|
|---|
| ChTry MALDI |
|
|---|
| ArgC MALDI |
|
|---|
| LysN MALDI |
|
|---|
| TryLysC MALDI |
|
|---|
| Try LTQ |
|
|---|
| ChTry LTQ |
|
|---|
| ArgC LTQ |
|
|---|
| LysN LTQ |
|
|---|
| TryLysC LTQ |
|
|---|
| Try MSlow |
|
|---|
| ChTry MSlow |
|
|---|
| ArgC MSlow |
|
|---|
| LysN MSlow |
|
|---|
| TryLysC MSlow |
|
|---|
| Try MShigh |
|
|---|
| ChTry MShigh |
|
|---|
| ArgC MShigh |
|
|---|
| LysN MShigh |
|
|---|
| TryLysC MShigh |
|
|---|
General Statistics
Number of major isoforms |
Number of additional isoforms |
Number of all proteins |
Number of amino acids |
Min. Seq. Length |
Max. Seq. Length |
Avg. Seq. Length |
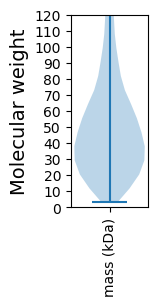
Avg. Mol. Weight |
|---|---|---|---|---|---|---|---|
0 |
3936409 |
25 |
7870 |
493.5 |
54.69 |
Amino acid frequency
Ala |
Cys |
Asp |
Glu |
Phe |
Gly |
His |
Ile |
Lys |
Leu |
|---|---|---|---|---|---|---|---|---|---|
8.173 ± 0.022 | 1.193 ± 0.01 |
5.619 ± 0.02 | 6.395 ± 0.029 |
3.675 ± 0.018 | 6.576 ± 0.023 |
2.388 ± 0.013 | 5.118 ± 0.021 |
5.242 ± 0.026 | 8.871 ± 0.032 |
Met |
Asn |
Gln |
Pro |
Arg |
Ser |
Thr |
Val |
Trp |
Tyr |
|---|---|---|---|---|---|---|---|---|---|
2.106 ± 0.01 | 3.816 ± 0.013 |
6.198 ± 0.034 | 4.125 ± 0.024 |
6.078 ± 0.021 | 8.781 ± 0.032 |
5.891 ± 0.018 | 5.771 ± 0.019 |
1.279 ± 0.008 | 2.705 ± 0.014 |
Most of the basic statistics you can see at this page can be downloaded from this CSV file
See this proteome in:

Proteome-pI is available under Creative Commons Attribution-NoDerivs license, for more details see here
| Reference: Kozlowski LP. Proteome-pI 2.0: Proteome Isoelectric Point Database Update. Nucleic Acids Res. 2021, doi: 10.1093/nar/gkab944 | Contact: Lukasz P. Kozlowski |